Fig. 12
Download original image
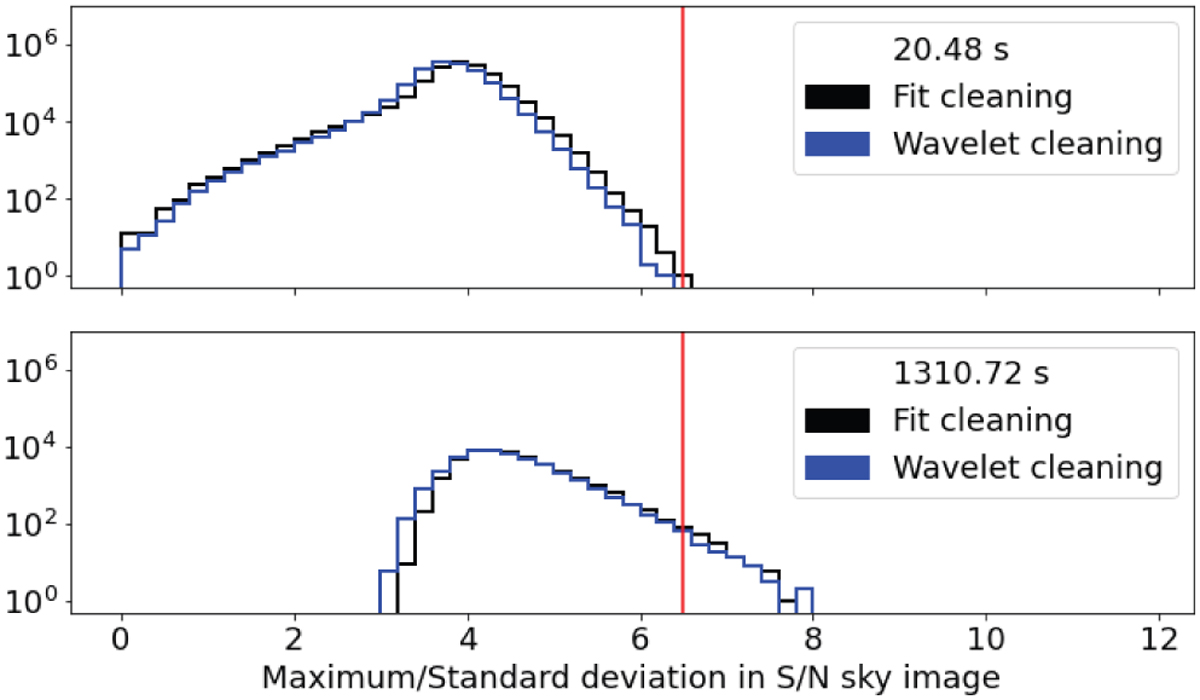
Distribution of the maximum value divided by the standard deviation for each S/N sky image of 20 s (top, 1 510 398 entries) and 20 min (bottom, 44 895 entries) of the 1-yr simulation. The black and blue curves correspond to the images where the CXB was cleaned using the fit method and the wavelet method, respectively. The red vertical bar corresponds to a value of 6.5.
Current usage metrics show cumulative count of Article Views (full-text article views including HTML views, PDF and ePub downloads, according to the available data) and Abstracts Views on Vision4Press platform.
Data correspond to usage on the plateform after 2015. The current usage metrics is available 48-96 hours after online publication and is updated daily on week days.
Initial download of the metrics may take a while.