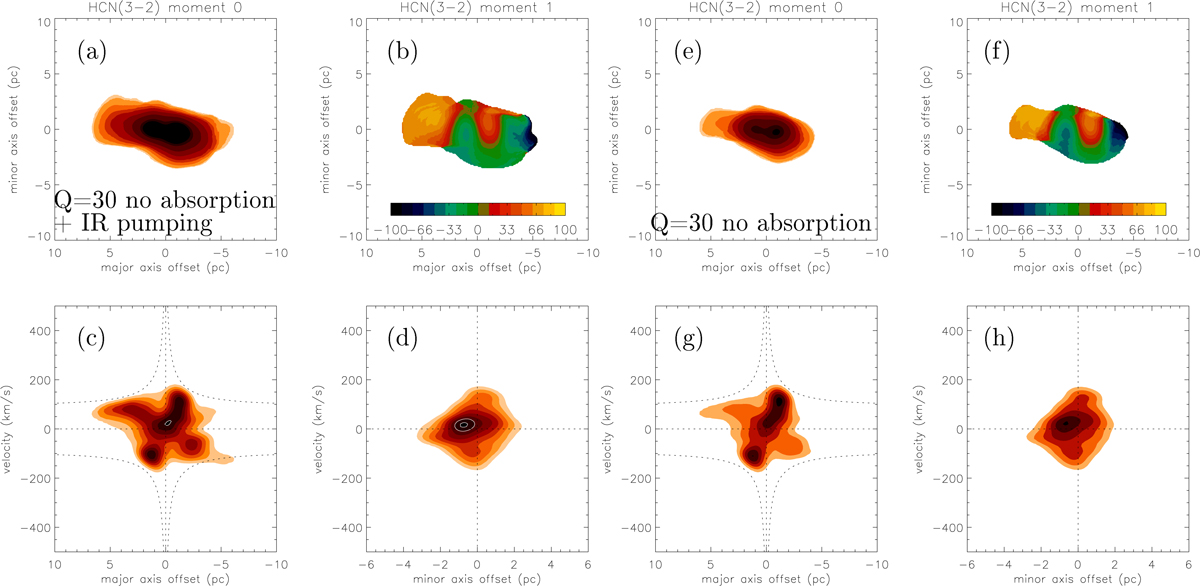
Fig. 28.
Download original image
NGC 1068 dense disk cloud model without absorption. Left panel: Q = 30 model high resolution HCN(3−2) emission of the dense disk cloud model. Right panel: same as left panel but with IR-pumping included in the model. Panels (a) and (e) moment 0 maps, (b) and (f) moment 1 maps, (c) and (g) pv diagrams along the major axis, (d) and (h) pv diagrams along the minor axis. The model levels are the same as those of the observed maps (Fig. 18). The additional white contours levels are 80 and 90 K.
Current usage metrics show cumulative count of Article Views (full-text article views including HTML views, PDF and ePub downloads, according to the available data) and Abstracts Views on Vision4Press platform.
Data correspond to usage on the plateform after 2015. The current usage metrics is available 48-96 hours after online publication and is updated daily on week days.
Initial download of the metrics may take a while.