Fig. 19.
Download original image
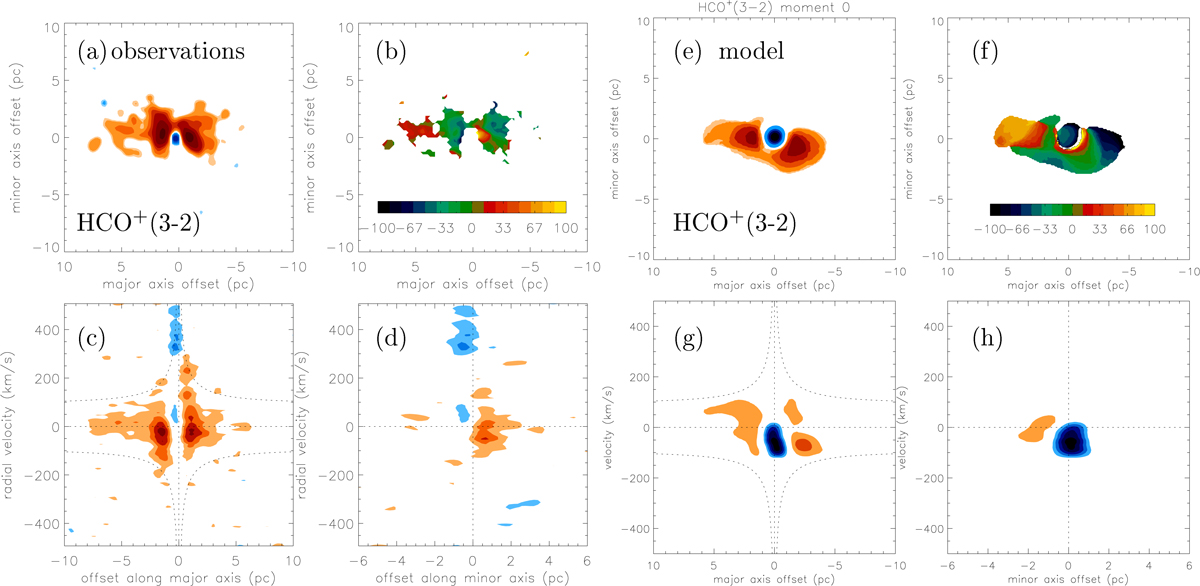
NGC 1068. Left half: high resolution HCO+(3−2) observations (Imanishi et al. 2020). Panel (a) moment 0 map (I0 = 18420 K km s−1), (b) moment 1 map (in km s−1), (c) pv diagram along the major axis, and (d) pv diagram along the minor axis (Tb0 = 75 K). Right half: dense disk cloud model. Panel (e) moment 0 map, (f) moment 1 map (in km s−1), (g) pv diagram along the major axis, and (h) pv diagram along the minor axis. The model levels are the same as those of the observed maps.
Current usage metrics show cumulative count of Article Views (full-text article views including HTML views, PDF and ePub downloads, according to the available data) and Abstracts Views on Vision4Press platform.
Data correspond to usage on the plateform after 2015. The current usage metrics is available 48-96 hours after online publication and is updated daily on week days.
Initial download of the metrics may take a while.