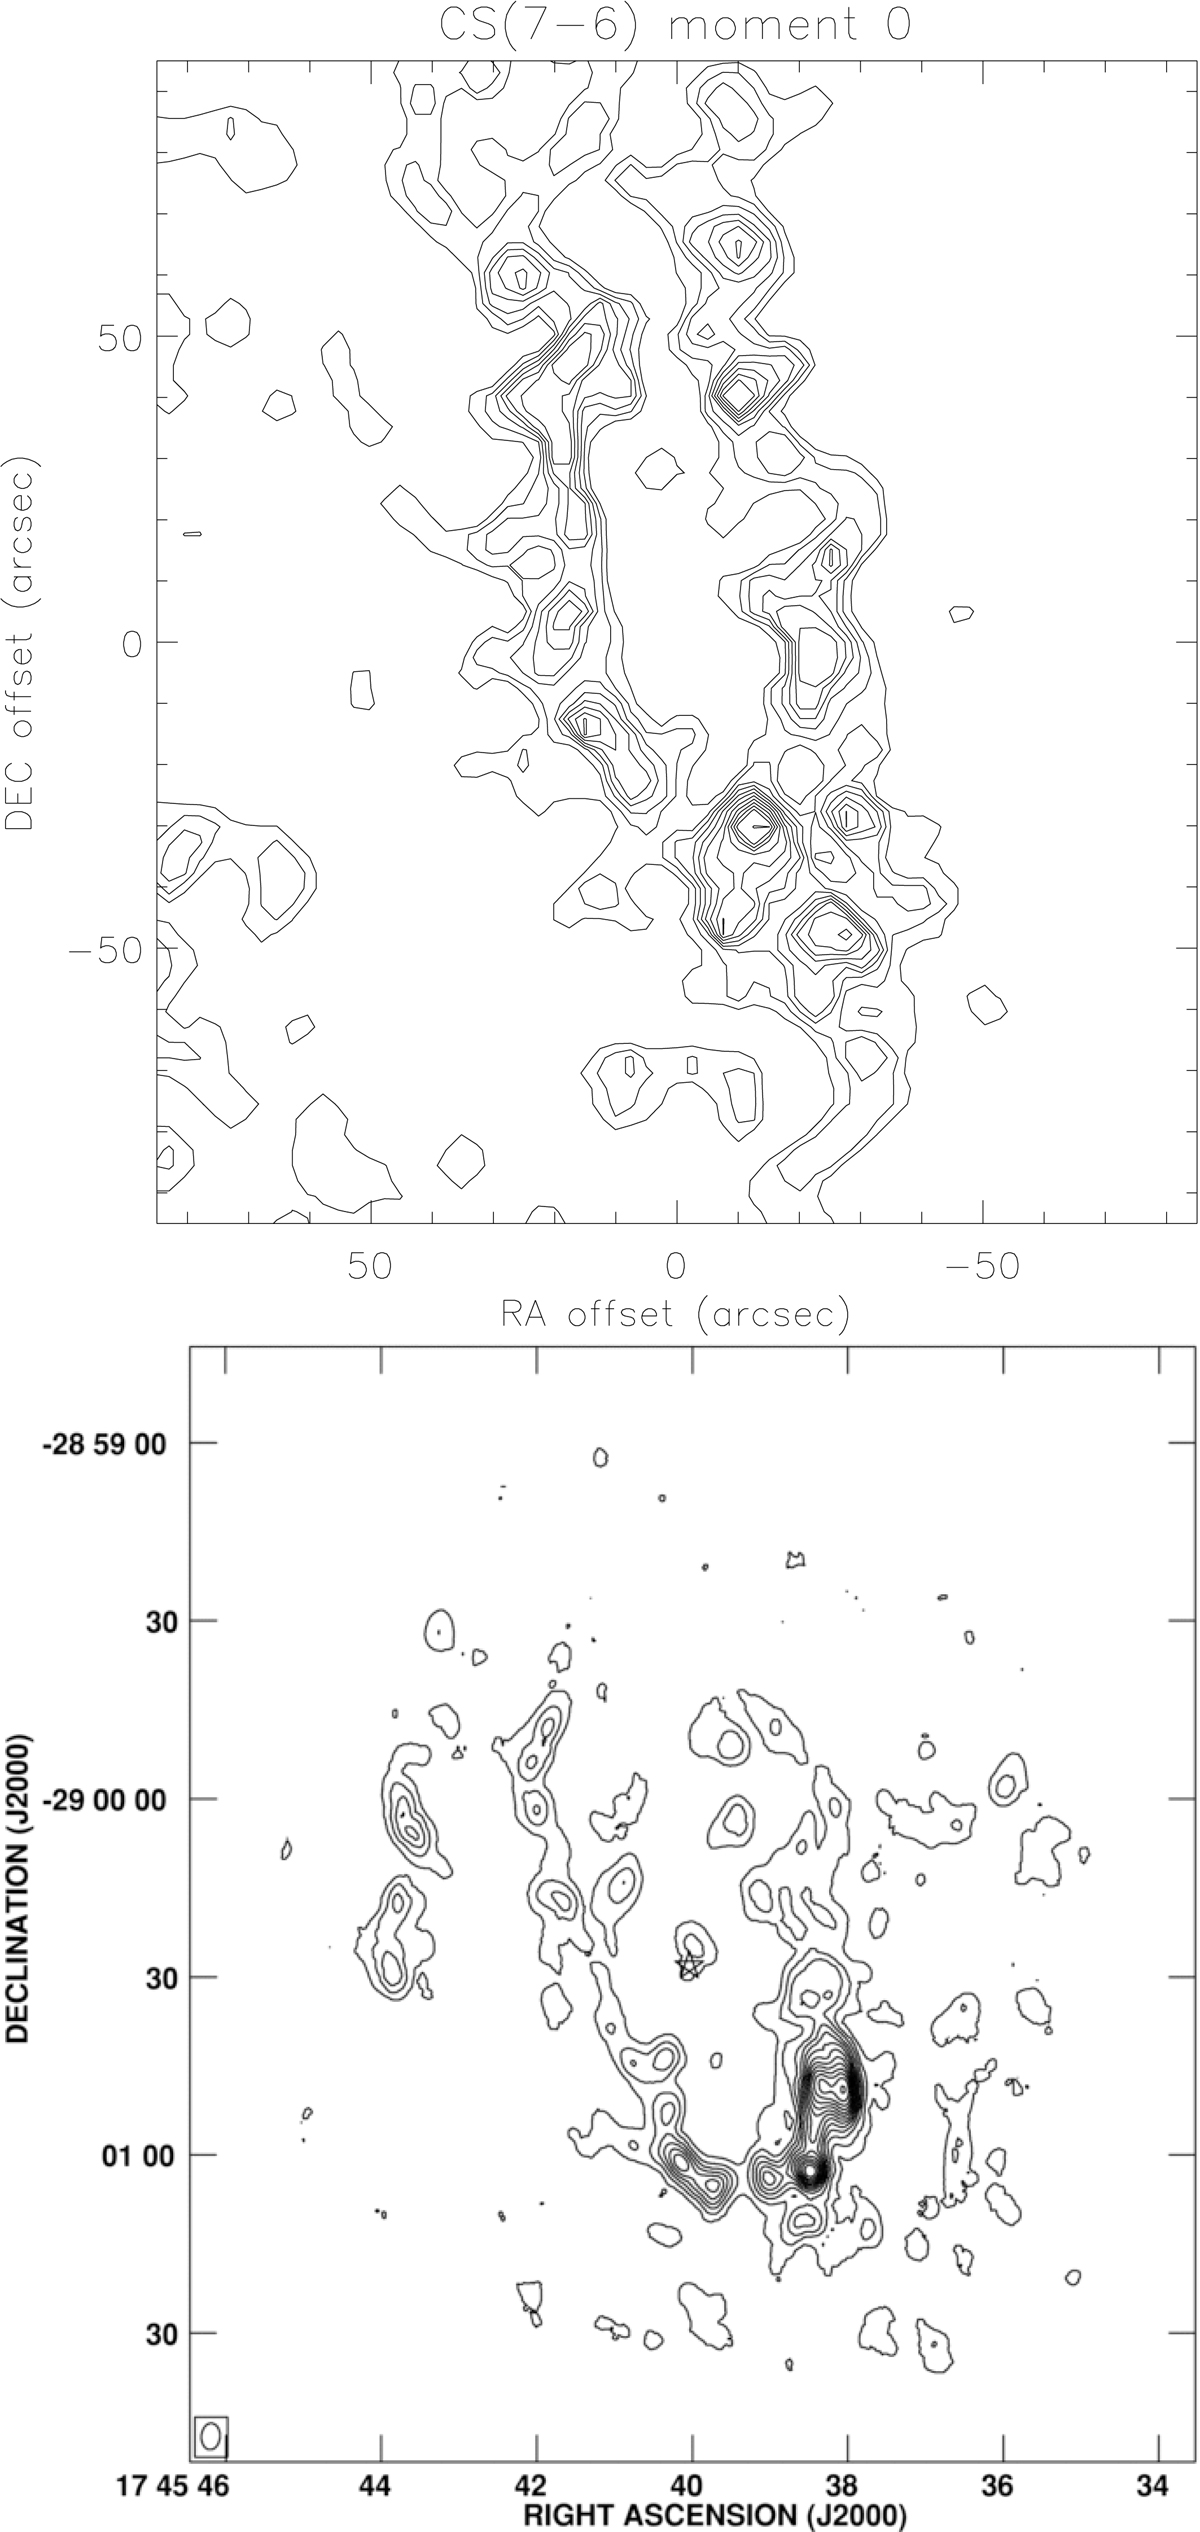
Fig. 10.
Download original image
CS(7−6) integrated intensity map. Upper panel: model. The contour levels are in steps of 22 K km s−1 from 11 to 275 K km s−1. The spatial resolution is 4.5″ × 3.1″. Lower panel: observations from Montero-Castaño et al. (2009). The rms is 2.5 K km s−1. The contour levels are in steps of 15 K km s−1 from 7 to 170 K km s−1, but for the highest contour level at 190 K km s−1. Sgr A* is marked with a star.
Current usage metrics show cumulative count of Article Views (full-text article views including HTML views, PDF and ePub downloads, according to the available data) and Abstracts Views on Vision4Press platform.
Data correspond to usage on the plateform after 2015. The current usage metrics is available 48-96 hours after online publication and is updated daily on week days.
Initial download of the metrics may take a while.