Fig. 8
Download original image
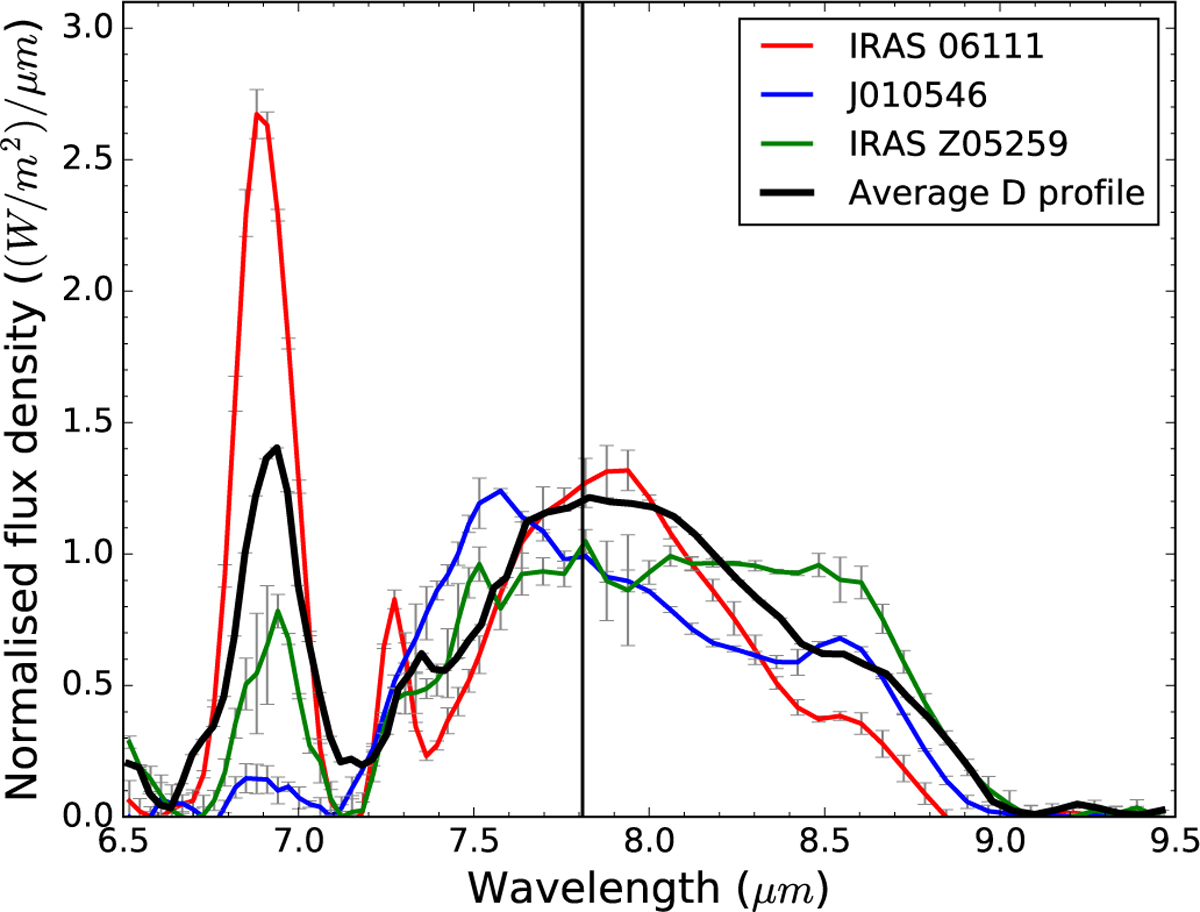
Average Class D profile spectrum (in Wm−2 µm−1), normalised to the flux of the 7.7 µm feature (solid black line). The vertical line marks the average peak wavelength of the 7.7 µm complex for Class D spectra (i.e. 7.8 µm). The three Class D spectra that showed the most deviation from the average are shown in red, blue, and green. Aliphatic bands are present at 6.9 and 7.25 µm.
Current usage metrics show cumulative count of Article Views (full-text article views including HTML views, PDF and ePub downloads, according to the available data) and Abstracts Views on Vision4Press platform.
Data correspond to usage on the plateform after 2015. The current usage metrics is available 48-96 hours after online publication and is updated daily on week days.
Initial download of the metrics may take a while.