Fig. 4
Download original image
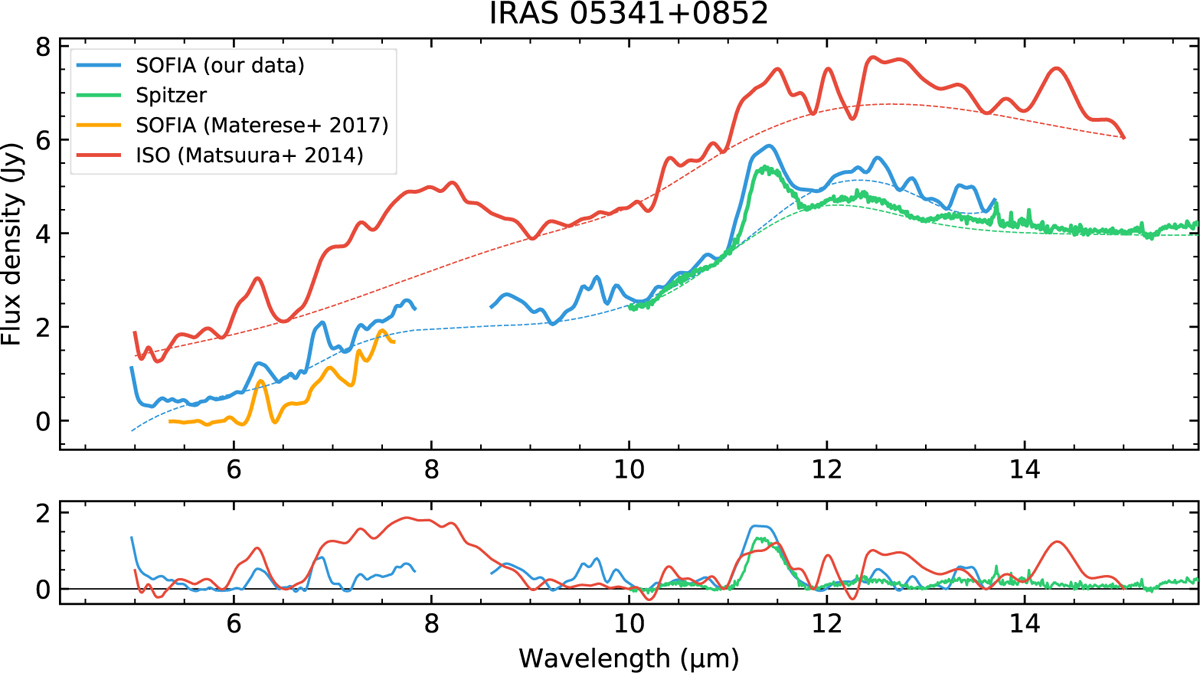
Our SOFIA spectrum of IRAS 05341+0852 (blue) is compared to other spectra from the literature, including another SOFIA spectrum (orange; Materese et al. 2017), a Spitzer/IRS spectrum (AORkey: 4896512, PI: Dale Cruikshank), and an ISO/SWS spectrum (Matsuura et al. 2014). The dashed lines represent the applied continua for the corresponding spectra (in the same colour). The lower panel displays the residual after subtracting a spline continuum. See Sect. 3.3 for details.
Current usage metrics show cumulative count of Article Views (full-text article views including HTML views, PDF and ePub downloads, according to the available data) and Abstracts Views on Vision4Press platform.
Data correspond to usage on the plateform after 2015. The current usage metrics is available 48-96 hours after online publication and is updated daily on week days.
Initial download of the metrics may take a while.