Fig. 3
Download original image
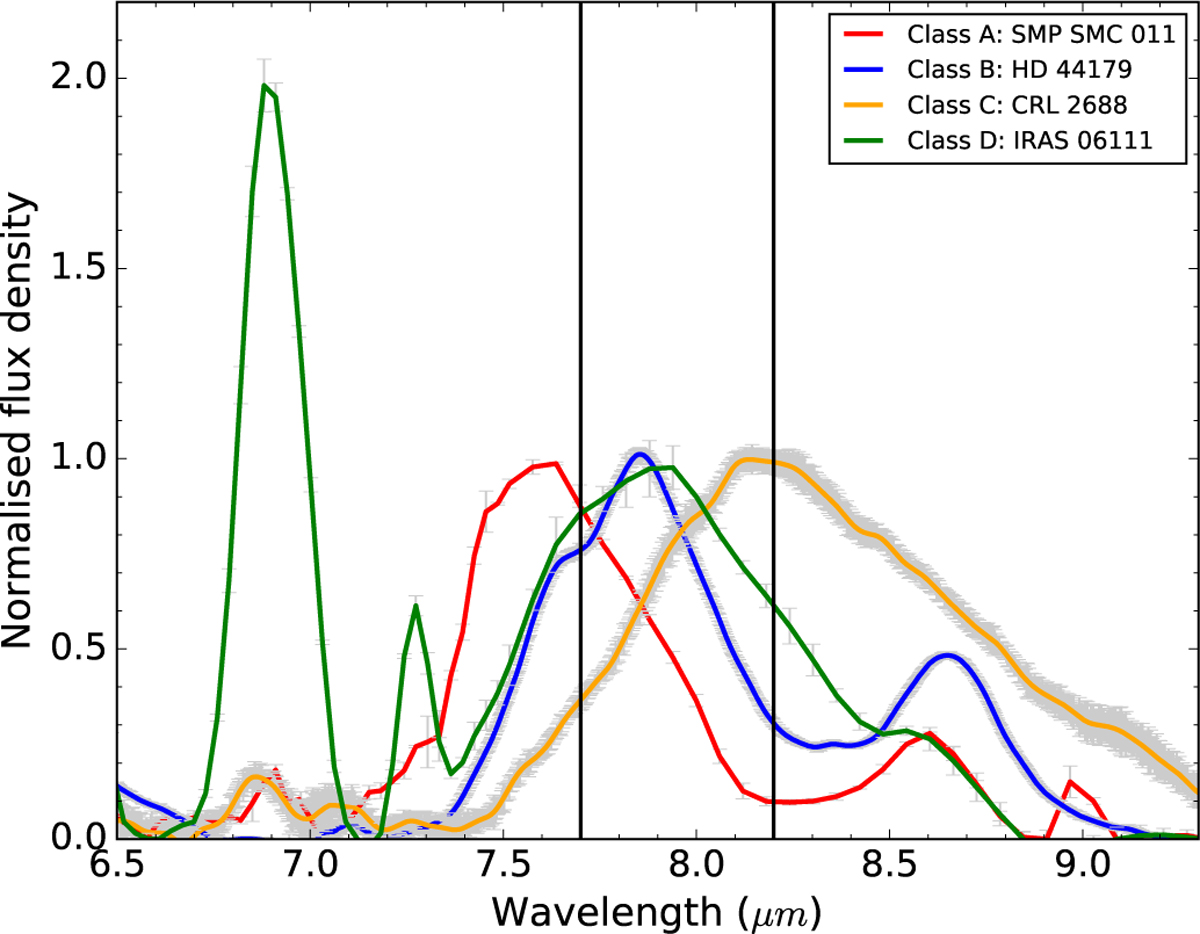
Example spectra for each of the profile classes (in Wm2 µm−1), normalised to the integrated flux of the 7.7 µm feature. The solid vertical lines drawn at 7.7 and 8.2 µm illustrate how the peak wavelength of the 7.7 µm complex changes with profile class. Spectra belonging to Class A peak shortward of 7.7 µm and spectra belonging to Class C peak around 8.2 µm whereas spectra belonging to Classes B or D peak in between. These examples are representative for Classes A and C as those classes only exhibit small variations, but not for Classes B and D.
Current usage metrics show cumulative count of Article Views (full-text article views including HTML views, PDF and ePub downloads, according to the available data) and Abstracts Views on Vision4Press platform.
Data correspond to usage on the plateform after 2015. The current usage metrics is available 48-96 hours after online publication and is updated daily on week days.
Initial download of the metrics may take a while.