Fig. 14
Download original image
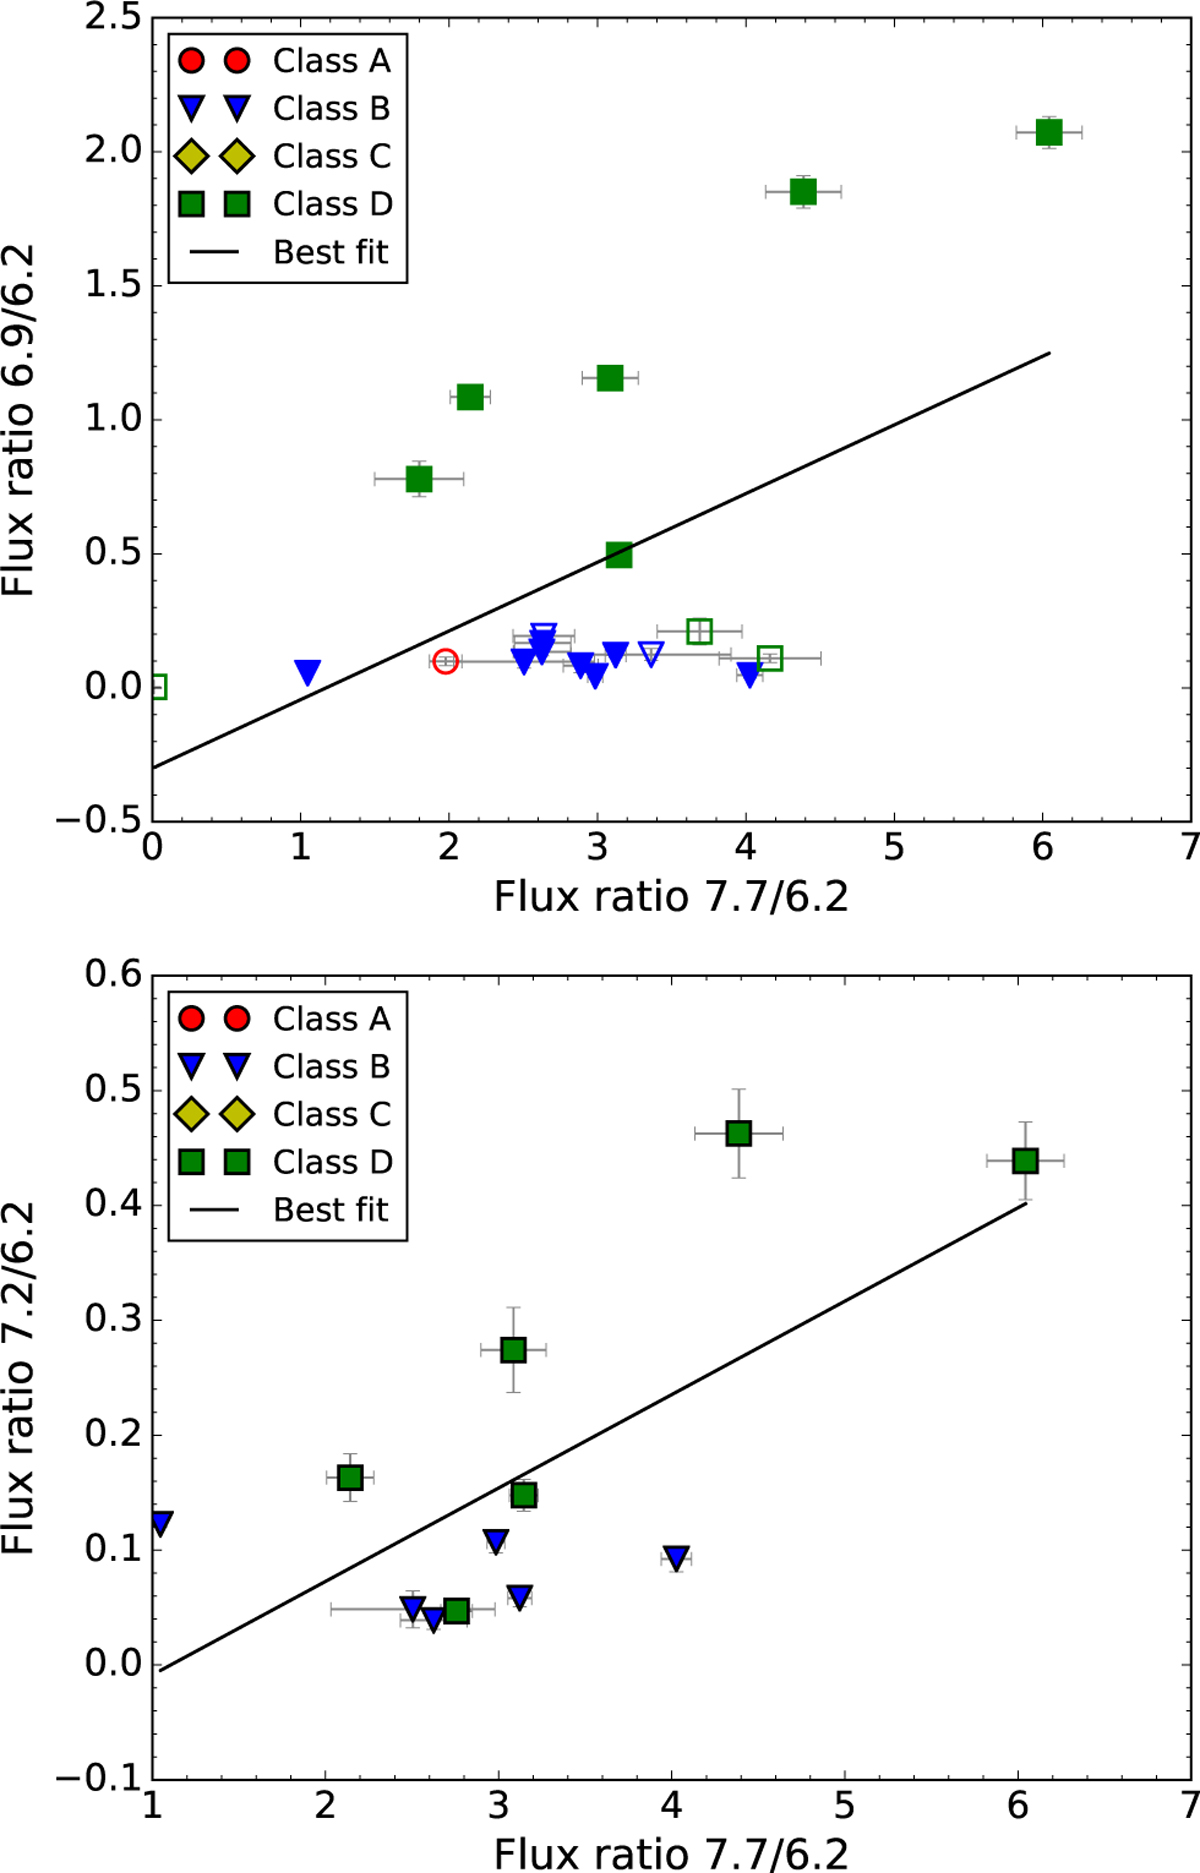
Intensities of the 6.9 (top) and 7.25 µm (bottom) aliphatic bands compared to the 7.7 µm feature intensities normalised to the intensity of the 6.2 µm feature. Filled markers represent sources where both aliphatic features have been detected, while unfilled markers represent sources where only the 6.9 µm feature has been detected. The correlation coefficient is 0.84 and 0.38 for the 6.9 and 7.25 µm bands, respectively.
Current usage metrics show cumulative count of Article Views (full-text article views including HTML views, PDF and ePub downloads, according to the available data) and Abstracts Views on Vision4Press platform.
Data correspond to usage on the plateform after 2015. The current usage metrics is available 48-96 hours after online publication and is updated daily on week days.
Initial download of the metrics may take a while.