Fig. 10
Download original image
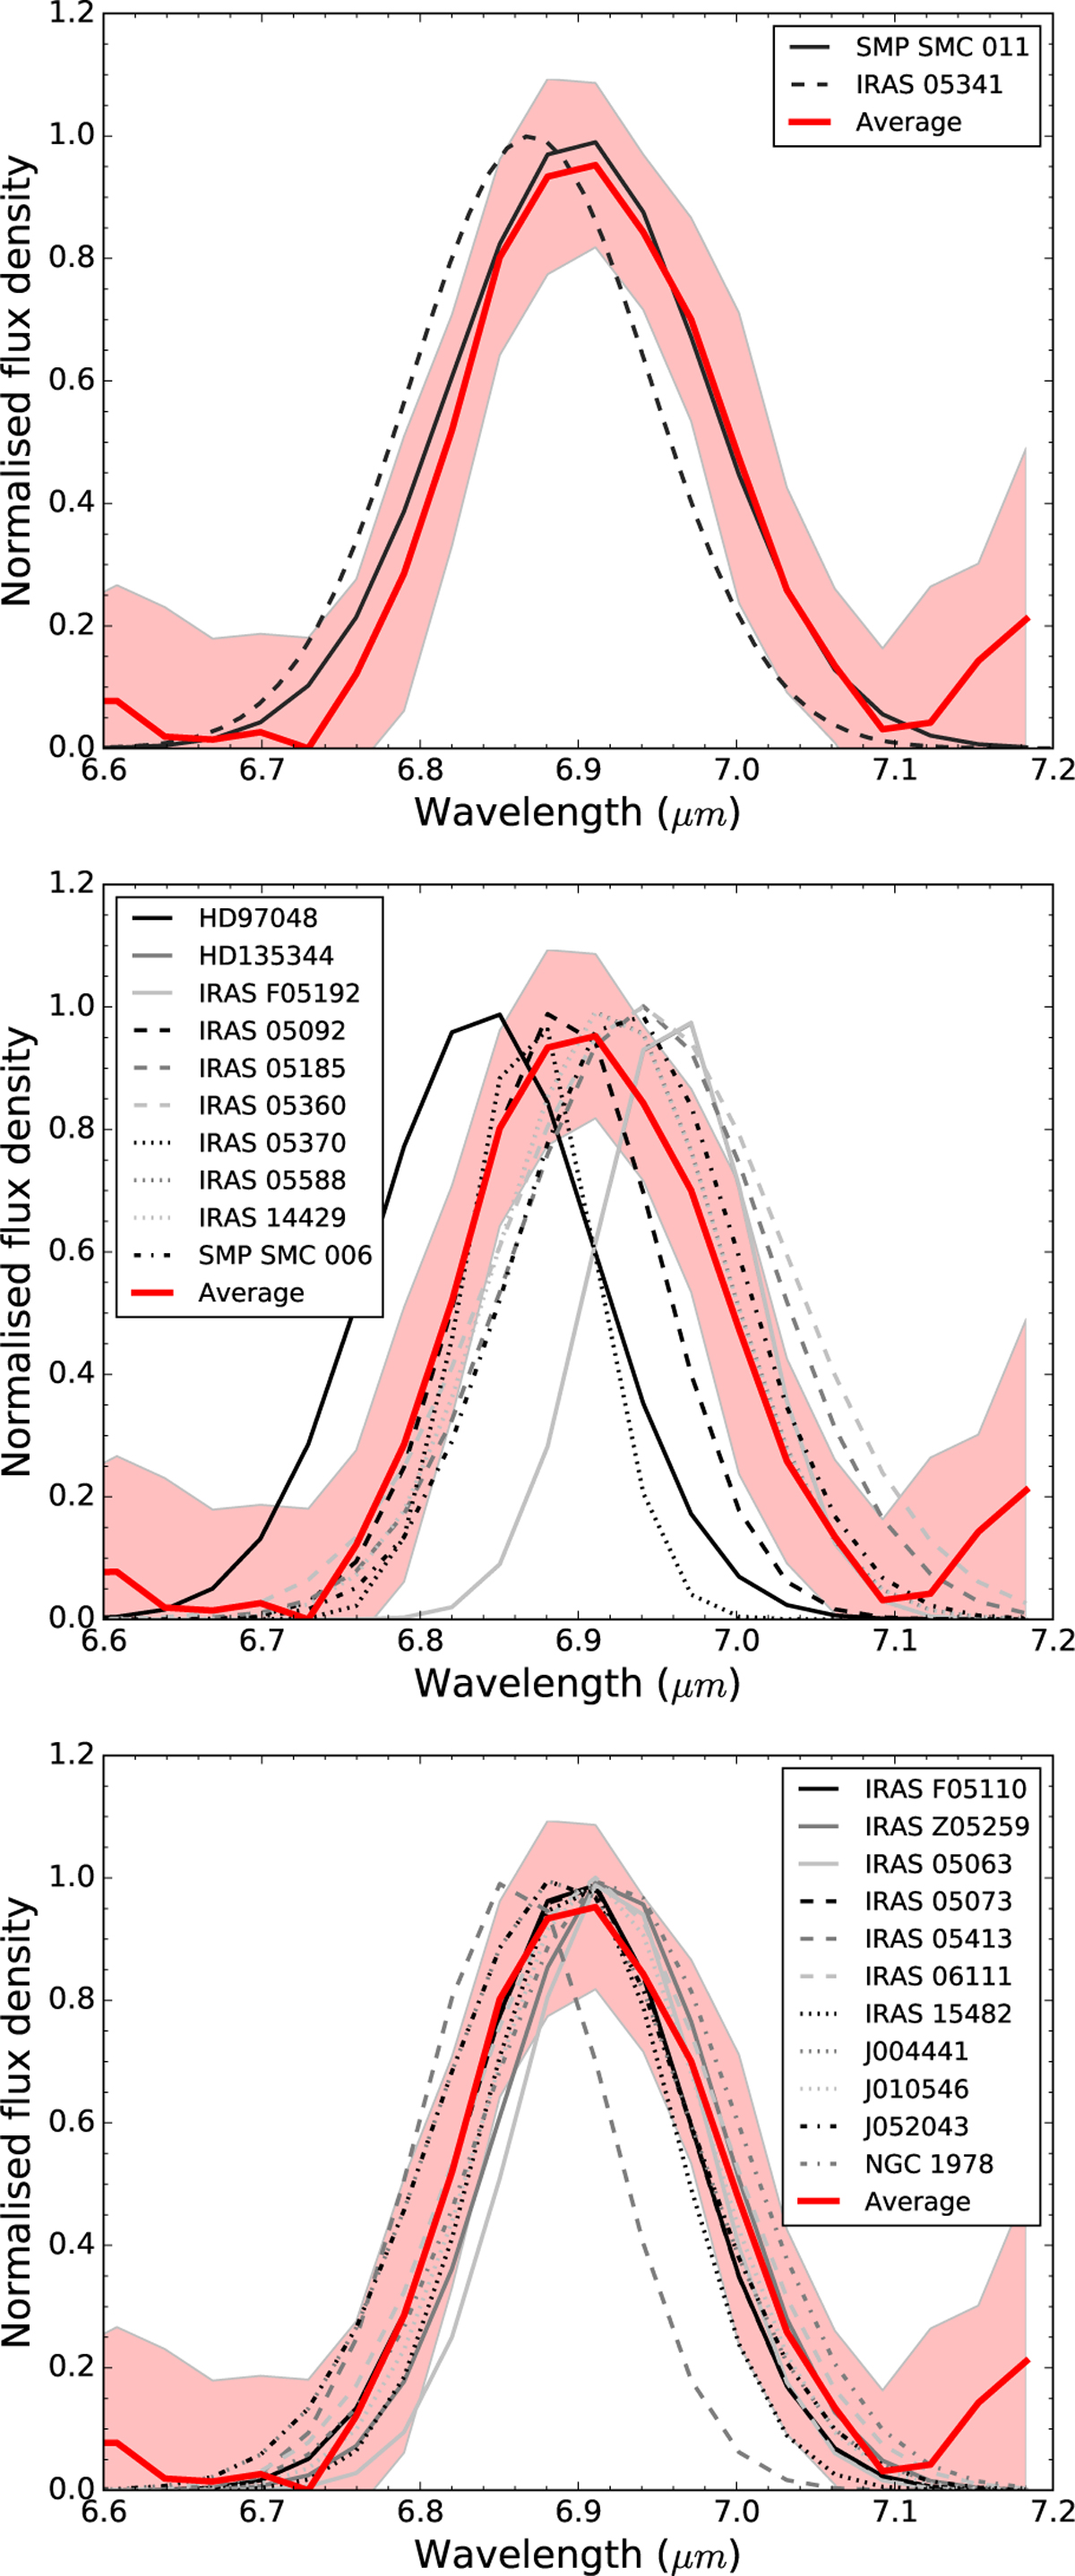
Average 6.9 µm profile based on 24 spectra with a 3σ detection of this band (red). The envelope on the average feature represents a 1σ variation in the profile. The individual 6.9 µm band profiles of SMP SMC Oil (Class A) and IRAS 05341 (Class undetermined) (top), Class B (middle) and Class D (bottom) are shown in grey-scale. For Class B, a representative sample is shown for clarity. The band profiles (in Wm−2 µm−1) were normalised to the fitted peak flux densities of the features.
Current usage metrics show cumulative count of Article Views (full-text article views including HTML views, PDF and ePub downloads, according to the available data) and Abstracts Views on Vision4Press platform.
Data correspond to usage on the plateform after 2015. The current usage metrics is available 48-96 hours after online publication and is updated daily on week days.
Initial download of the metrics may take a while.