Open Access
Fig. 1
Download original image
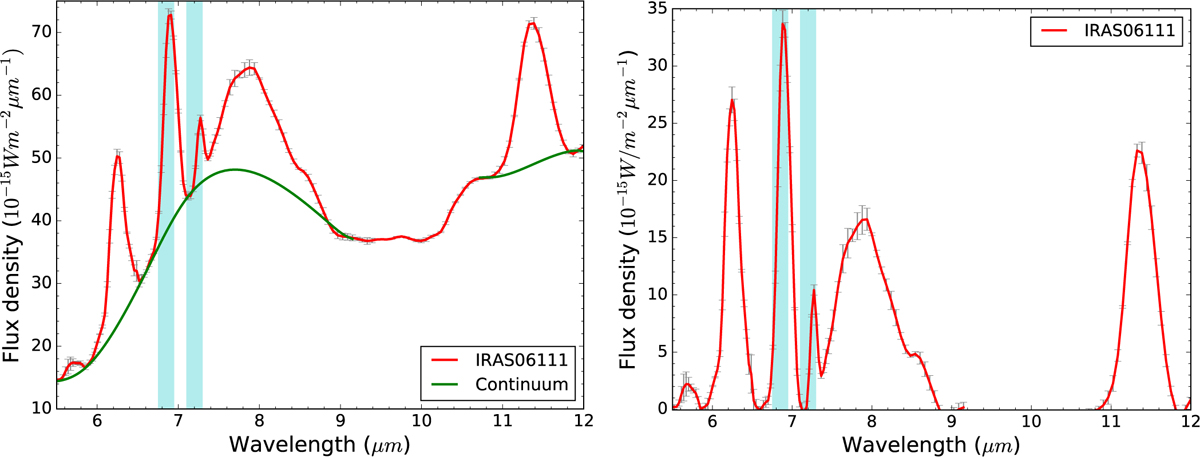
Spectrum of IRAS 06111-7023. Left: a spline continuum is drawn to isolate the emission features. The vertical blue shading denotes regions in which aliphatic emission is often present (near 6.9 and 7.25 µm). Right: the same spectrum after subtracting the spline continuum.
Current usage metrics show cumulative count of Article Views (full-text article views including HTML views, PDF and ePub downloads, according to the available data) and Abstracts Views on Vision4Press platform.
Data correspond to usage on the plateform after 2015. The current usage metrics is available 48-96 hours after online publication and is updated daily on week days.
Initial download of the metrics may take a while.