Open Access
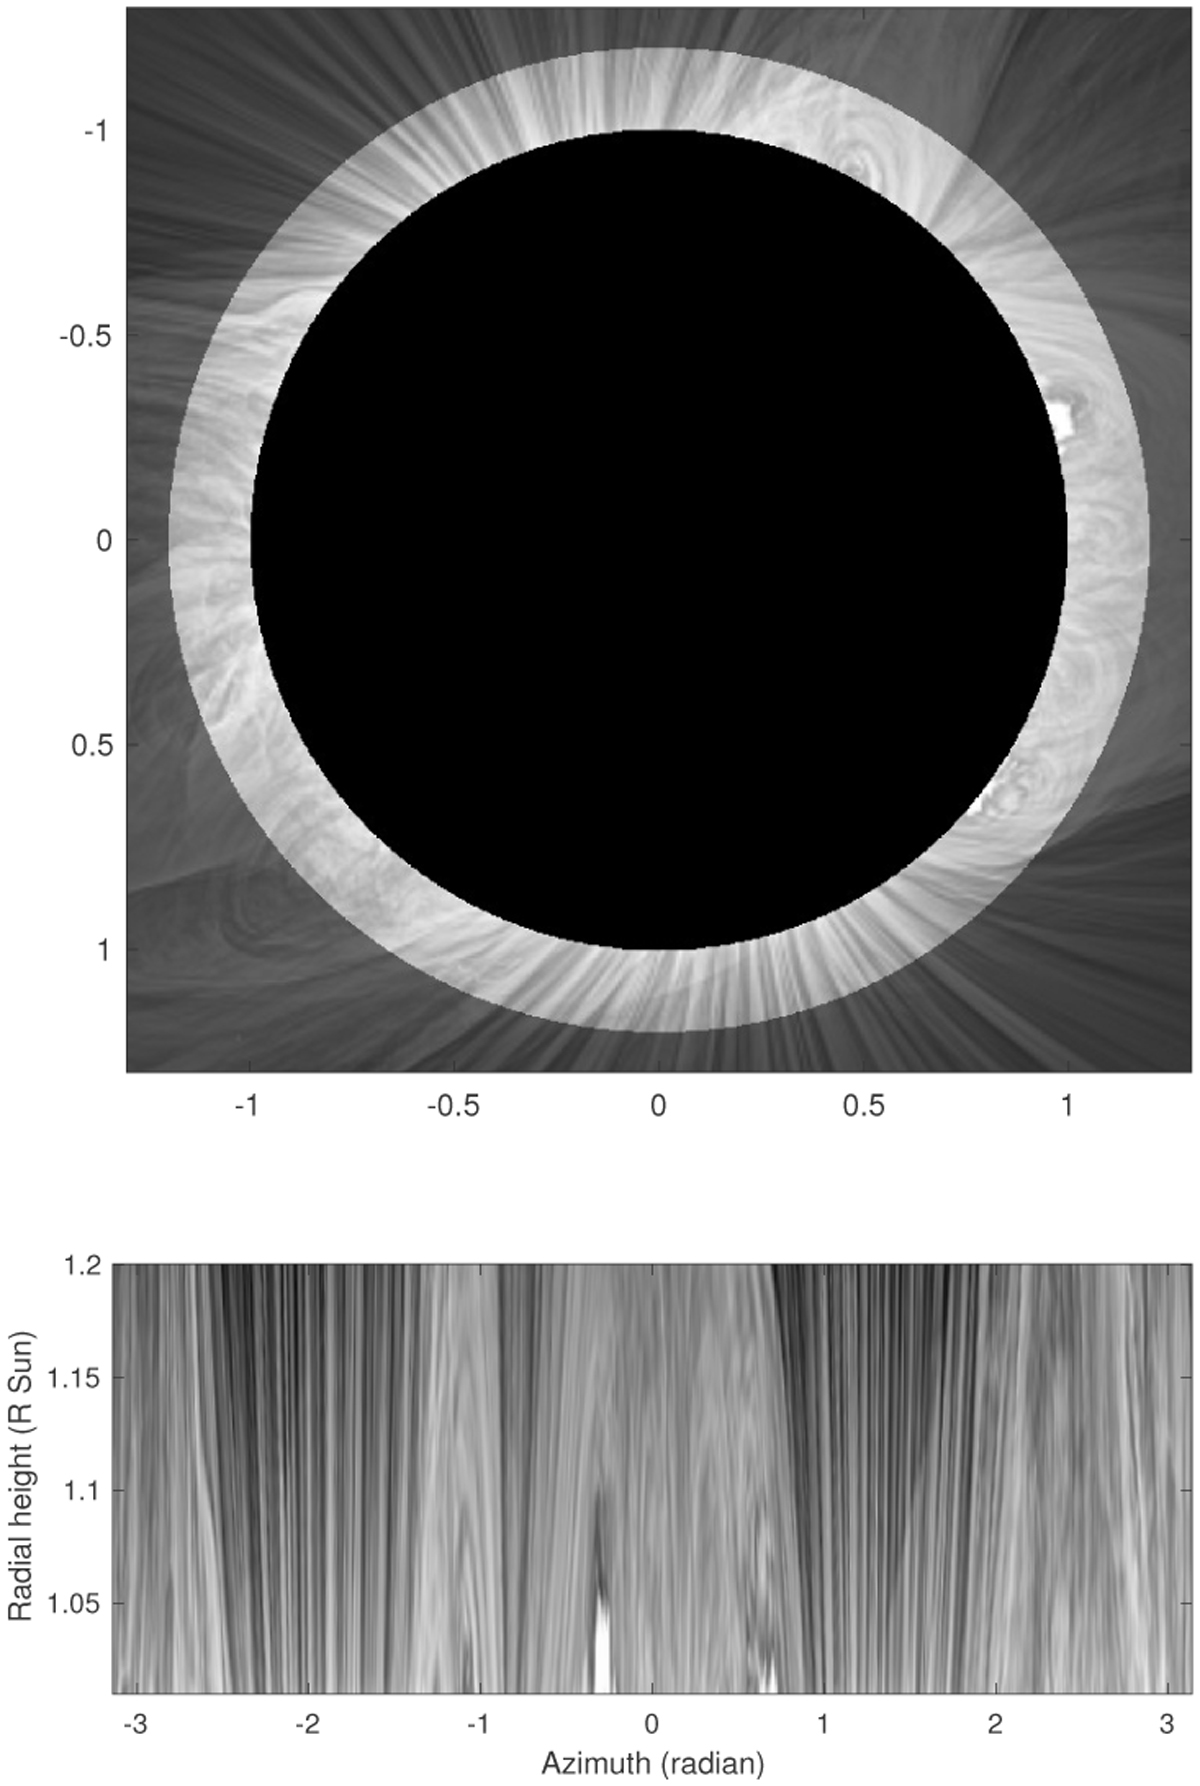
Fig. 6
Download original image
Solar eclipse observation of March 9, 2016 (thanks to Pr Miloslav Druckmüller) from which the data material is chosen. Top panel: direct image. Bottom panel: representation in polar coordinates of the highlighted region around the limb. The object x is a small fragment drawn from this image.
Current usage metrics show cumulative count of Article Views (full-text article views including HTML views, PDF and ePub downloads, according to the available data) and Abstracts Views on Vision4Press platform.
Data correspond to usage on the plateform after 2015. The current usage metrics is available 48-96 hours after online publication and is updated daily on week days.
Initial download of the metrics may take a while.