Open Access
Fig. 16
Download original image
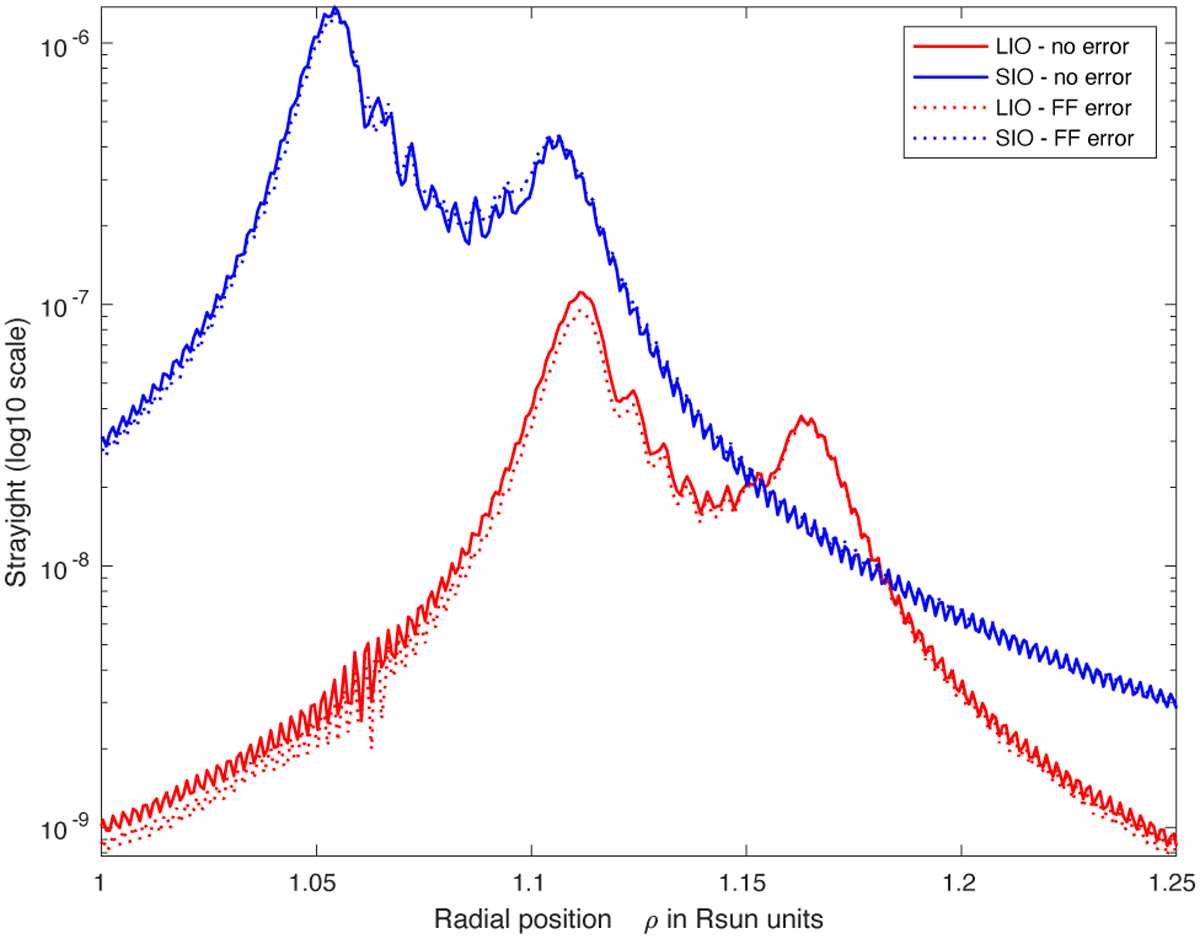
Expected level of straylight for SIO in blue, and LIO in red. The plain curves show the nominal case without formation flying errors, as in Fig.1. The dotted curves correspond to the case with the formation flying error, in the region where the straylight is weaker due to the displacement of the external occulter.
Current usage metrics show cumulative count of Article Views (full-text article views including HTML views, PDF and ePub downloads, according to the available data) and Abstracts Views on Vision4Press platform.
Data correspond to usage on the plateform after 2015. The current usage metrics is available 48-96 hours after online publication and is updated daily on week days.
Initial download of the metrics may take a while.