Fig. 15
Download original image
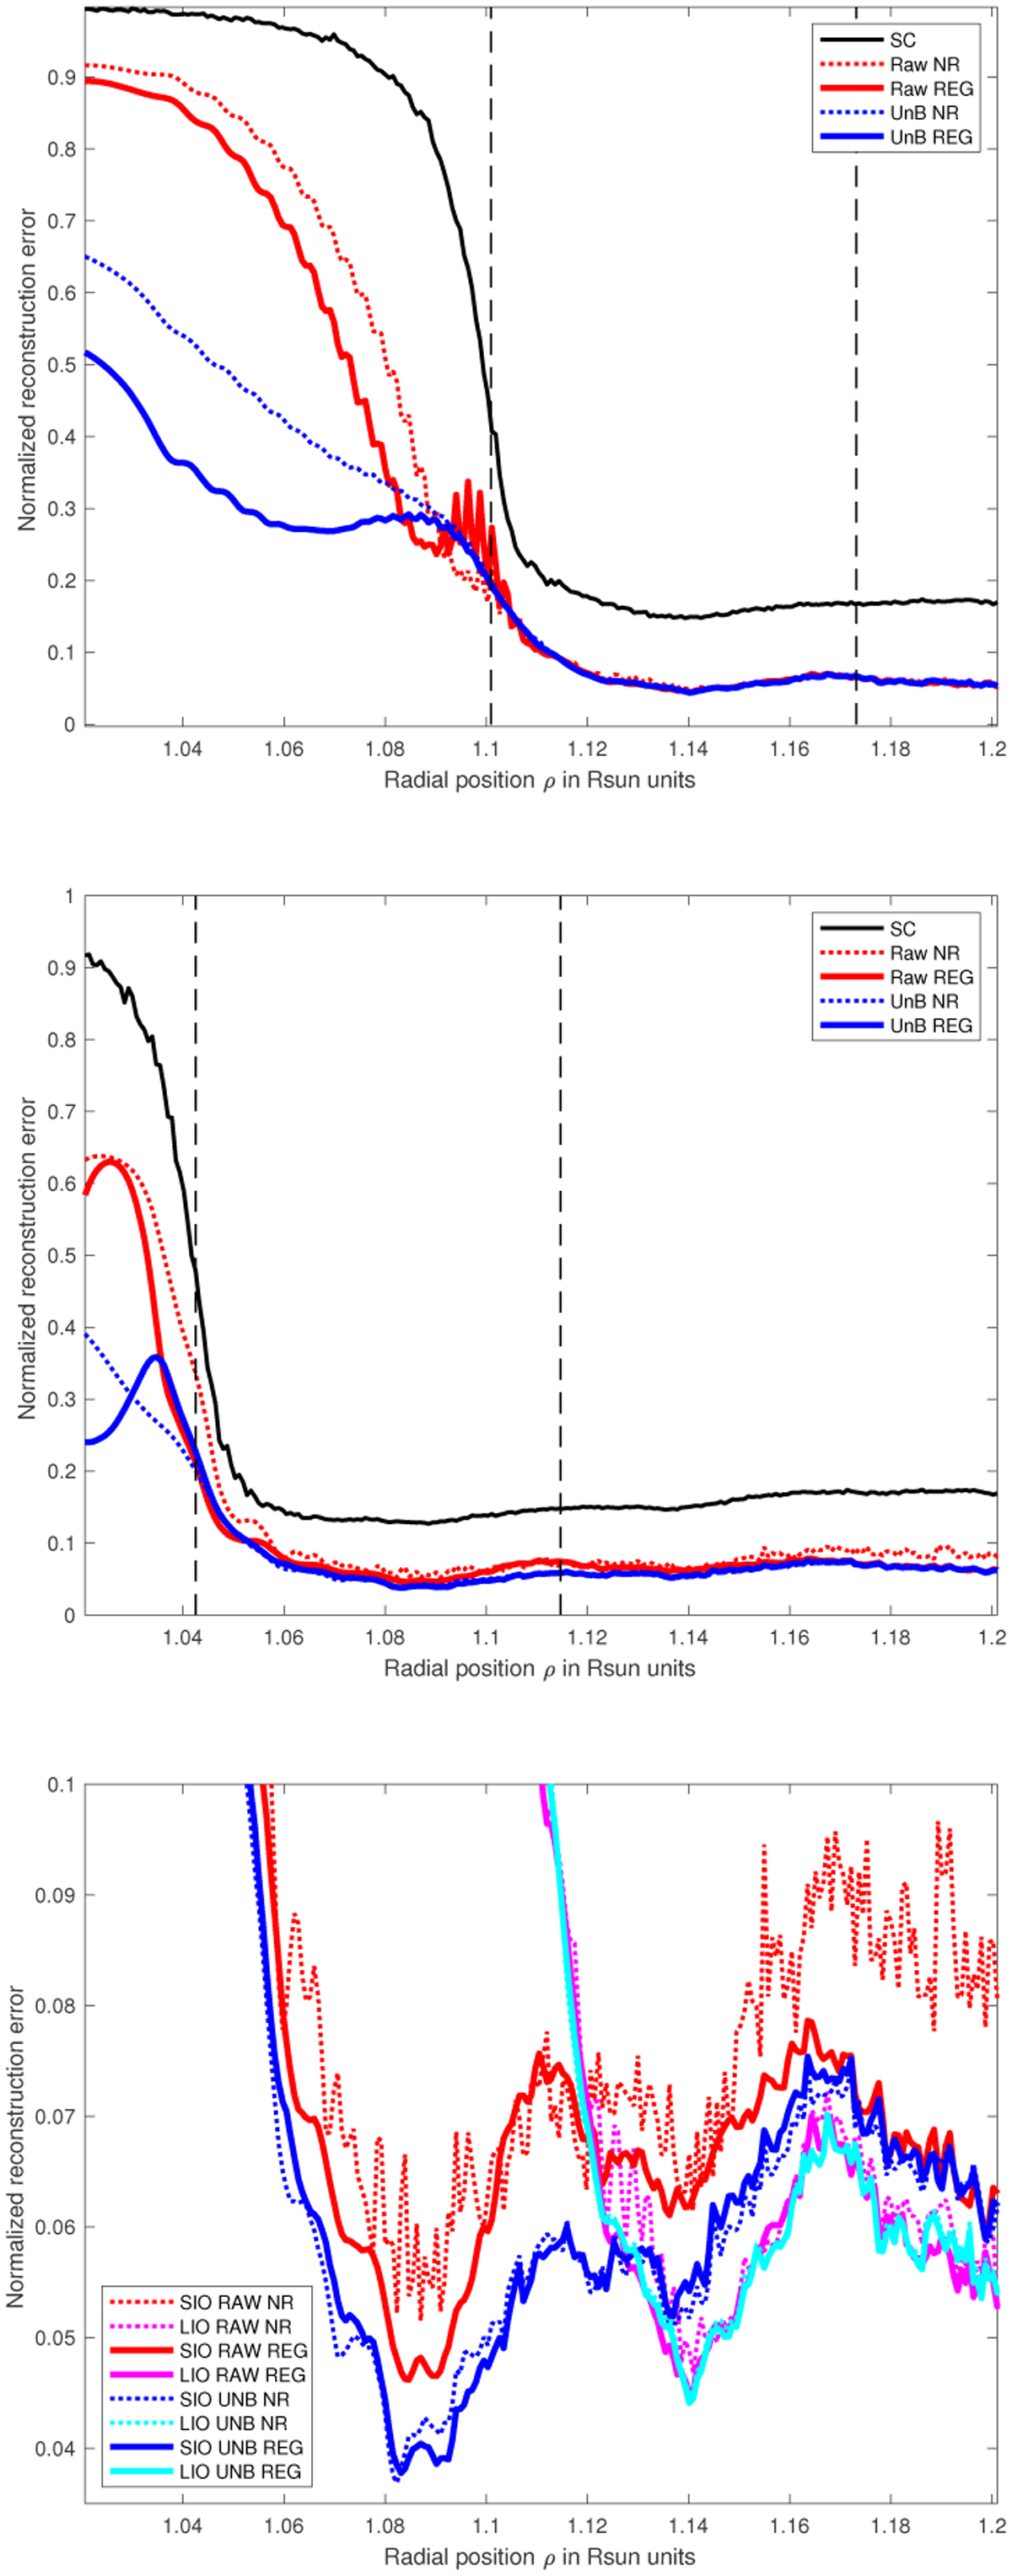
Error as a function of ρ, for LIO (top panel) and SIO (medium panel). Here, SC: simple correction; REG and NR: regularized and non-regularized algorithms; raw (red curves) and deb (blue curves): raw data and data after bias subtraction, respectively. Vertical dashed lines represent the geometrical limits of vignetting. Bottom panel: zoom on the error of the above figures. Raw data: red and magenta curves. Bias subtracted data: Blue and cyan curves. See more details in the text.
Current usage metrics show cumulative count of Article Views (full-text article views including HTML views, PDF and ePub downloads, according to the available data) and Abstracts Views on Vision4Press platform.
Data correspond to usage on the plateform after 2015. The current usage metrics is available 48-96 hours after online publication and is updated daily on week days.
Initial download of the metrics may take a while.