Open Access
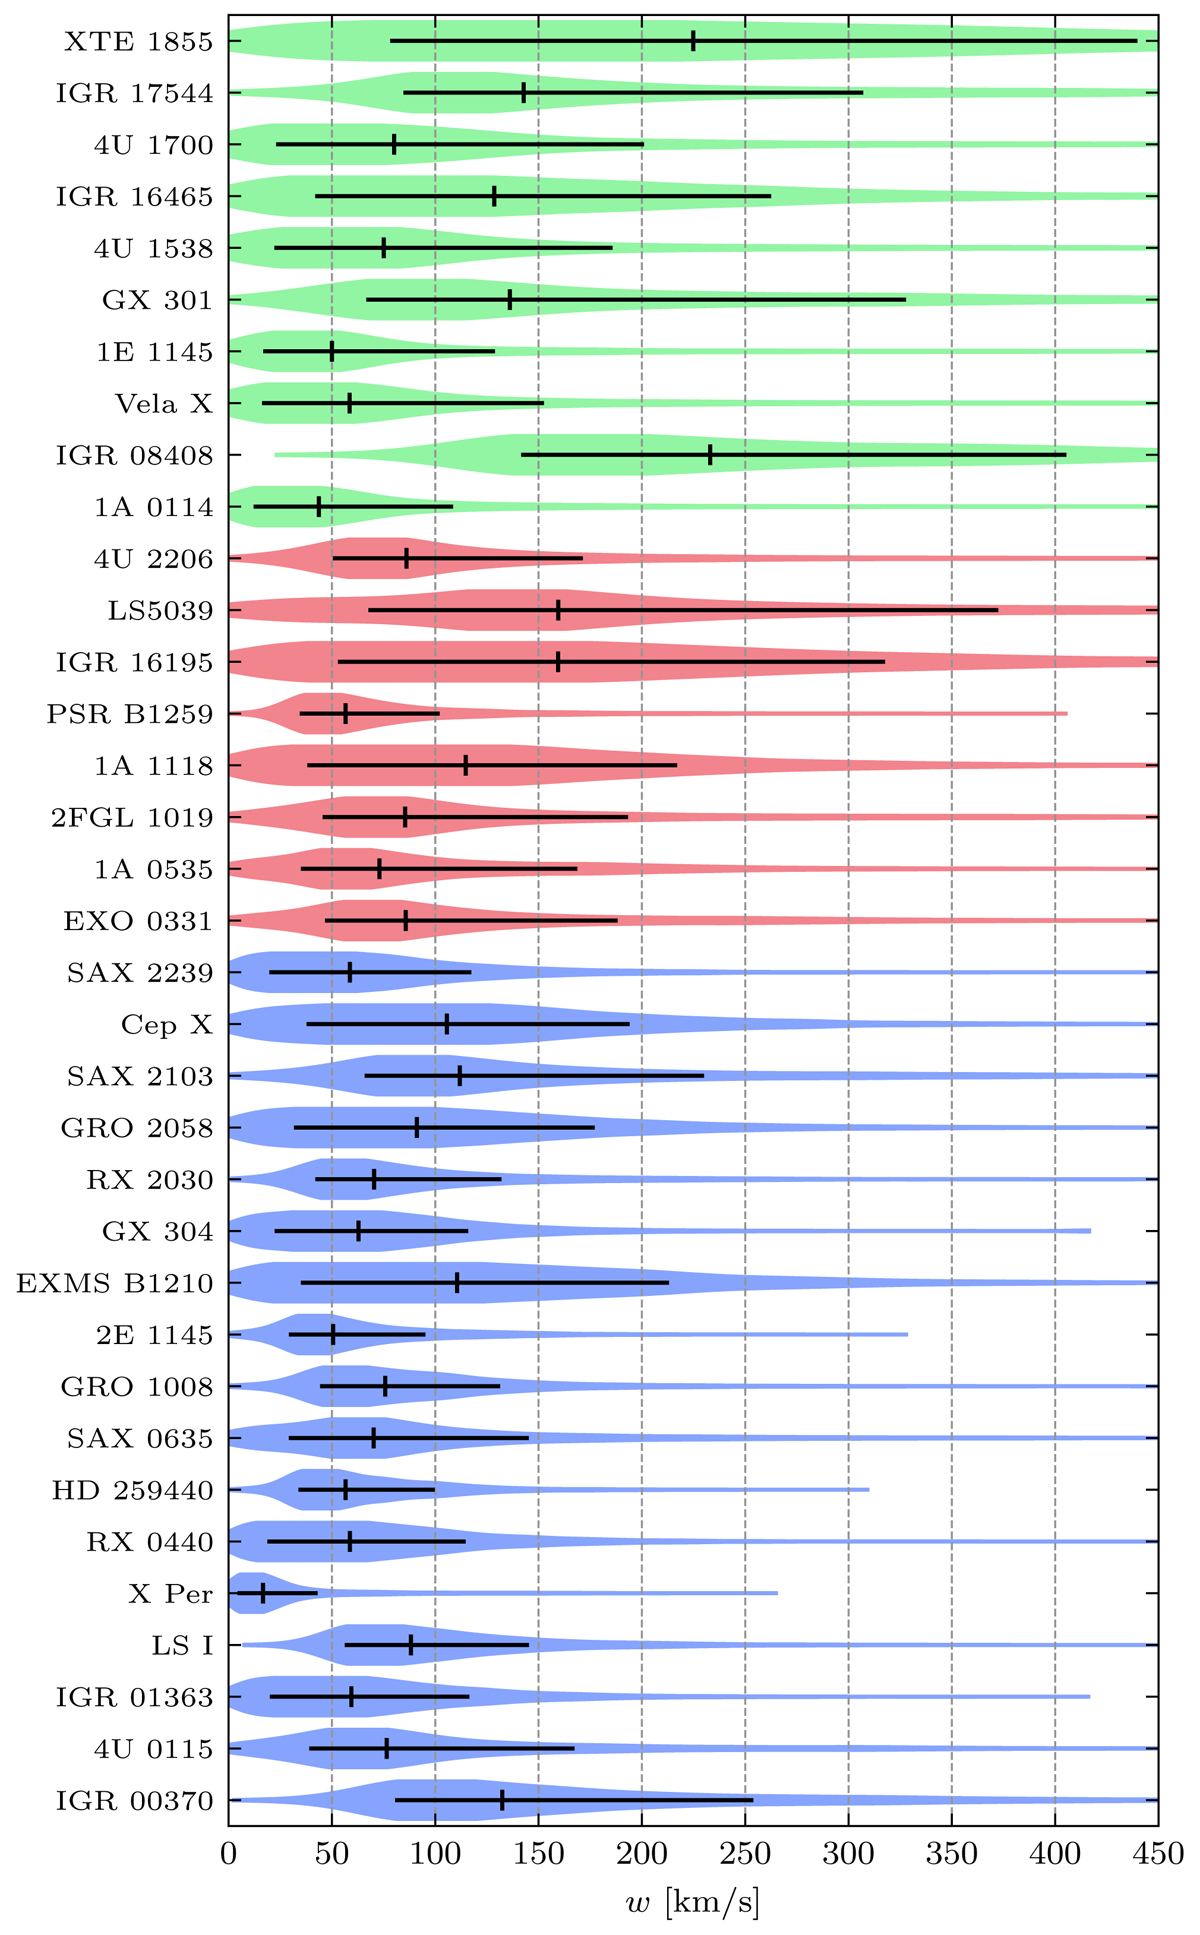
Fig. 3.
Download original image
Mirrored density plots of kick posteriors for individual binaries. The sg, Oe, and Be systems are shown in green, red, and blue, respectively. Posteriors are normalised to their maximum values. Source identifiers are cut for simplicity.
Current usage metrics show cumulative count of Article Views (full-text article views including HTML views, PDF and ePub downloads, according to the available data) and Abstracts Views on Vision4Press platform.
Data correspond to usage on the plateform after 2015. The current usage metrics is available 48-96 hours after online publication and is updated daily on week days.
Initial download of the metrics may take a while.