Open Access
Fig. B.1.
Download original image
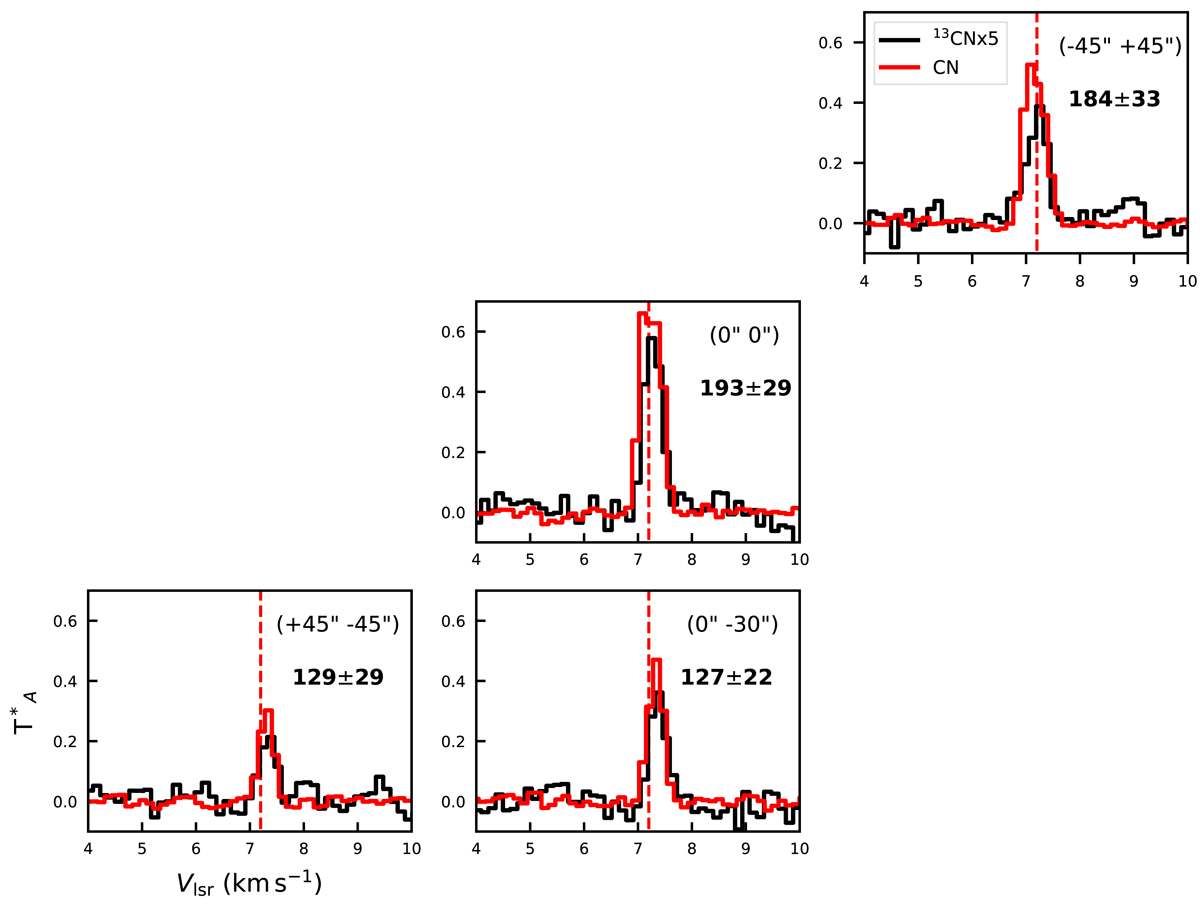
Spectra of 13CN (N =1-0 J = 3/2-1/2 F1 = 2-1 F = 3-2) in black and CN ( N =1-0 J = 1/2-1/2 F = 1-1) in red extracted in the regions shown as black circles in the left panel in Figure 3. The 12CN/13CN column density ratio derived towards the four offsets is written in boldface in each spectrum.
Current usage metrics show cumulative count of Article Views (full-text article views including HTML views, PDF and ePub downloads, according to the available data) and Abstracts Views on Vision4Press platform.
Data correspond to usage on the plateform after 2015. The current usage metrics is available 48-96 hours after online publication and is updated daily on week days.
Initial download of the metrics may take a while.