Fig. A.3.
Download original image
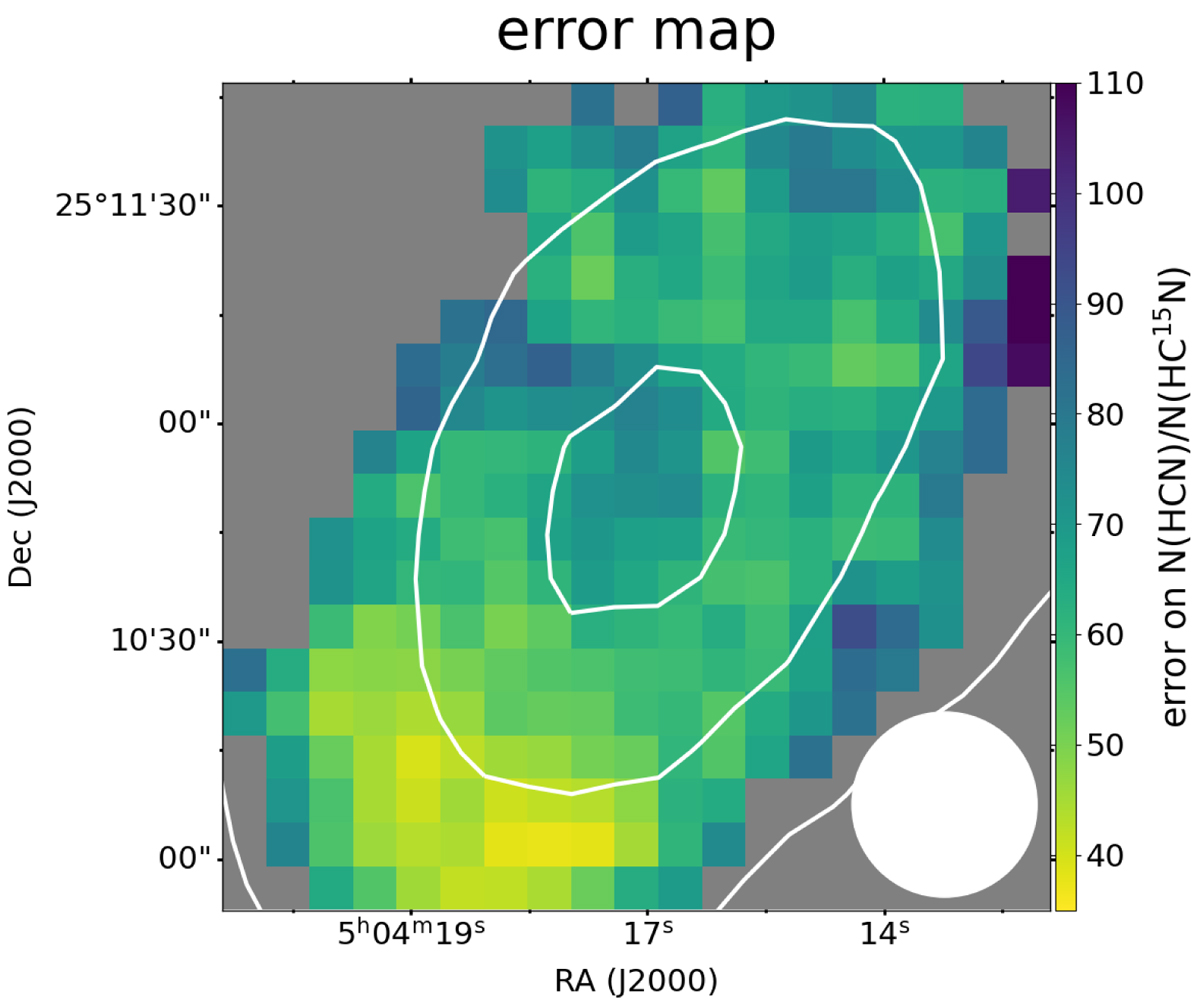
Error map of 14N/15N ratio of HCN towards L1544. The map was computed only in the pixels where the integrated emission of both H13CN and HC15N was detected with a signal-to-noise ratio larger than 5. The IRAM 30m beam of 30″ (∼5000 au) is shown in the bottom right of the map. The solid white contours are 30%, 60%, and 90% of the peak intensity of the N(H2) map of L1544 computed from Herschel/SPIRE data (Spezzano et al. 2016).
Current usage metrics show cumulative count of Article Views (full-text article views including HTML views, PDF and ePub downloads, according to the available data) and Abstracts Views on Vision4Press platform.
Data correspond to usage on the plateform after 2015. The current usage metrics is available 48-96 hours after online publication and is updated daily on week days.
Initial download of the metrics may take a while.