Fig. A.2.
Download original image
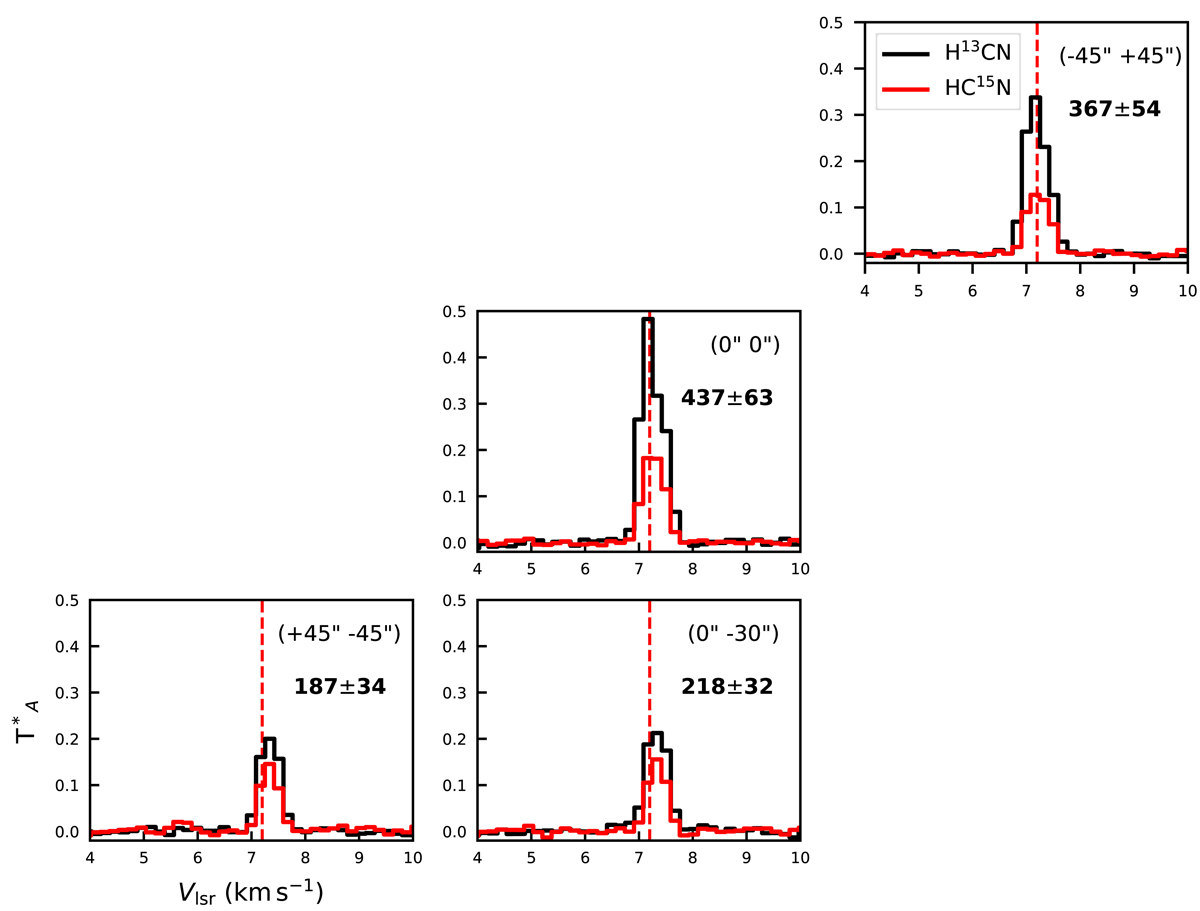
Spectra of H13CN (J, F = 1 2 - 0 1) in black and HC15N (N= 1-0) in red extracted in the regions shown as black circles in the left panel in Figure 3. The values in boldface report the 14N/15N ratio in HCN for each set of spectra derived using the 12C/13C ratio of 68 (Milam et al. 2005). We note the sharp decrease in the H13CN line towards the south, when compared to the almost constant HC15N.
Current usage metrics show cumulative count of Article Views (full-text article views including HTML views, PDF and ePub downloads, according to the available data) and Abstracts Views on Vision4Press platform.
Data correspond to usage on the plateform after 2015. The current usage metrics is available 48-96 hours after online publication and is updated daily on week days.
Initial download of the metrics may take a while.