Fig. 3.
Download original image
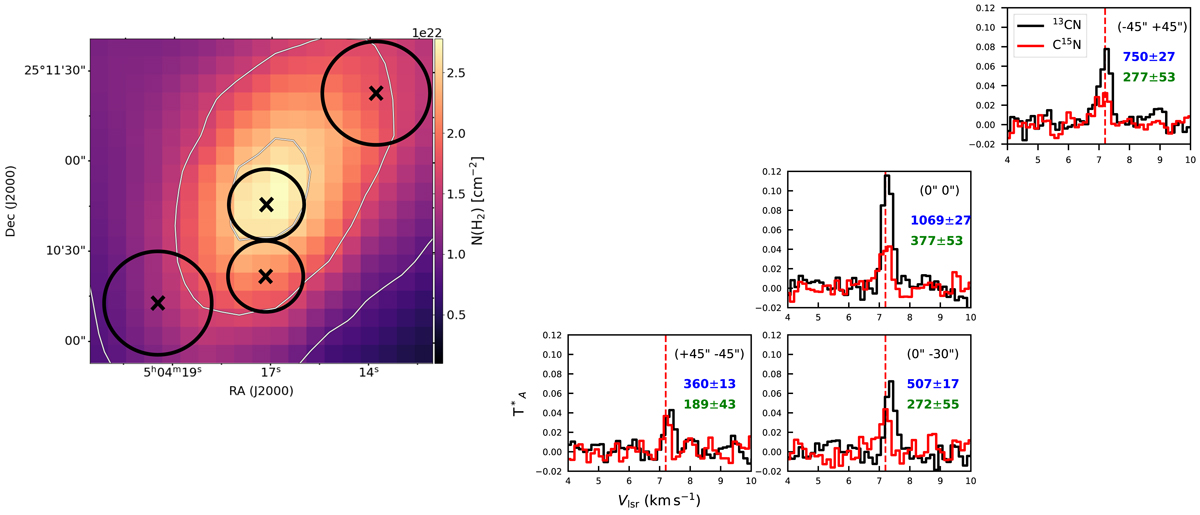
14N/15N ratio of CN in 4 positions across L1544. Left panel: H2 column density map of L1544 computed from Herschel/SPIRE observations (Spezzano et al. 2016). The black crosses show the centre of the areas where the spectra shown in the right panel have been extracted. The black circles show the regions where the spectra shown in the right panel have been averaged. Right panel: spectra of 13CN (N, J, F1, F = 1 3/2 2 3-0 1/2 1 2) in black and C15N (N, J, F= 1 3/2 2-0 1/2 1) in red, extracted towards the offsets marked in the left panel. The values in boldface in blue report the 14N/15N ratio in CN for each set of spectra derived using the 12CN column density directly from the spectra shown in Fig. B.1. The values in boldface in green report the 14N/15N ratio computed from the column density of 13CN using the 12C/13C ratio of 68 (Milam et al. 2005).
Current usage metrics show cumulative count of Article Views (full-text article views including HTML views, PDF and ePub downloads, according to the available data) and Abstracts Views on Vision4Press platform.
Data correspond to usage on the plateform after 2015. The current usage metrics is available 48-96 hours after online publication and is updated daily on week days.
Initial download of the metrics may take a while.