Fig. A.1.
Download original image
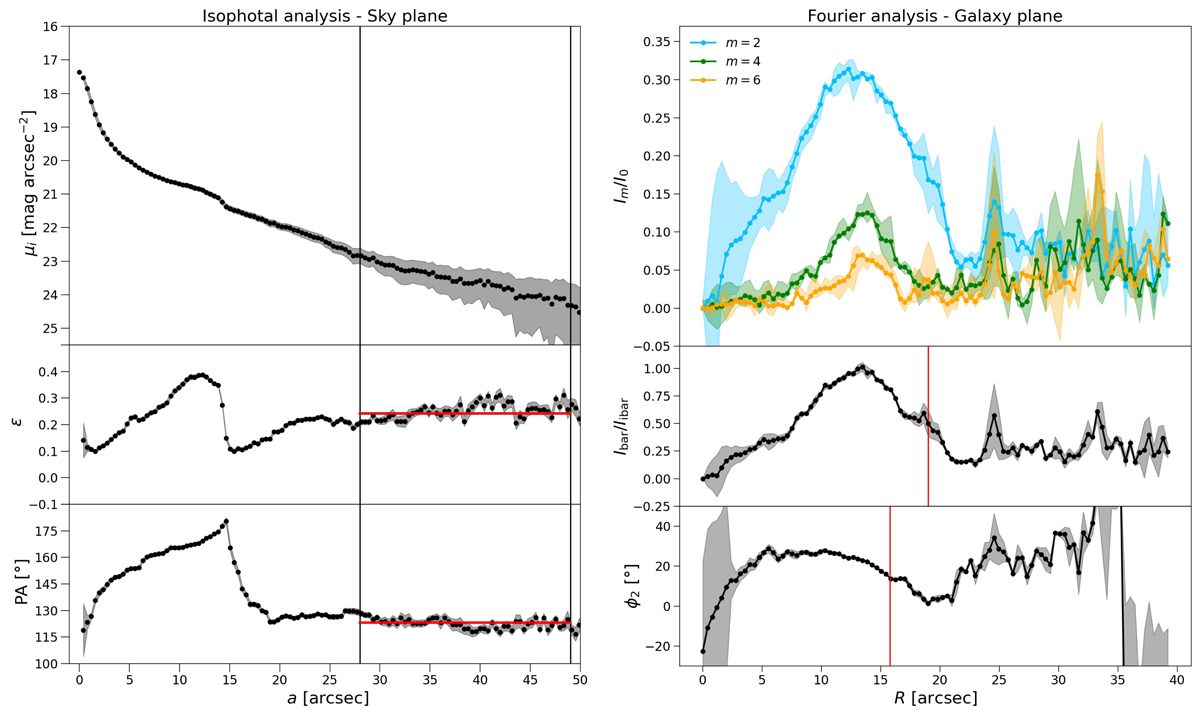
Left panels: Isophotal analysis of the i-band image of NGC 4277. The radial profiles of the surface brightness (upper panel), position angle (central panel), and ellipticity (lower panel) are shown as a function of the semi-major axis of the best-fitting isophotal ellipses. The vertical black lines bracket the radial range adopted to estimate the mean ellipticity (⟨ϵ⟩ = 0.242 ± 0.002) and position angle (⟨PA⟩ = 123![]() 27 ± 0
27 ± 0![]() 32) of the disc. Right panels: Fourier analysis of the deprojected i-band image of NGC 4277. The radial profiles of the relative amplitude of the m = 2 (blue points), m = 4 (green points), and m = 6 (yellow points) Fourier components (upper panel), bar-interbar intensity ratio (central panel), and phase angle ϕ2 of the m = 2 Fourier component (lower panel) are shown as a function of galactocentric distance. The vertical red lines in the central and lower panels mark the bar radii Rbar/ibar and Rϕ2, respectively.
32) of the disc. Right panels: Fourier analysis of the deprojected i-band image of NGC 4277. The radial profiles of the relative amplitude of the m = 2 (blue points), m = 4 (green points), and m = 6 (yellow points) Fourier components (upper panel), bar-interbar intensity ratio (central panel), and phase angle ϕ2 of the m = 2 Fourier component (lower panel) are shown as a function of galactocentric distance. The vertical red lines in the central and lower panels mark the bar radii Rbar/ibar and Rϕ2, respectively.
Current usage metrics show cumulative count of Article Views (full-text article views including HTML views, PDF and ePub downloads, according to the available data) and Abstracts Views on Vision4Press platform.
Data correspond to usage on the plateform after 2015. The current usage metrics is available 48-96 hours after online publication and is updated daily on week days.
Initial download of the metrics may take a while.