Fig. 3.

Download original image
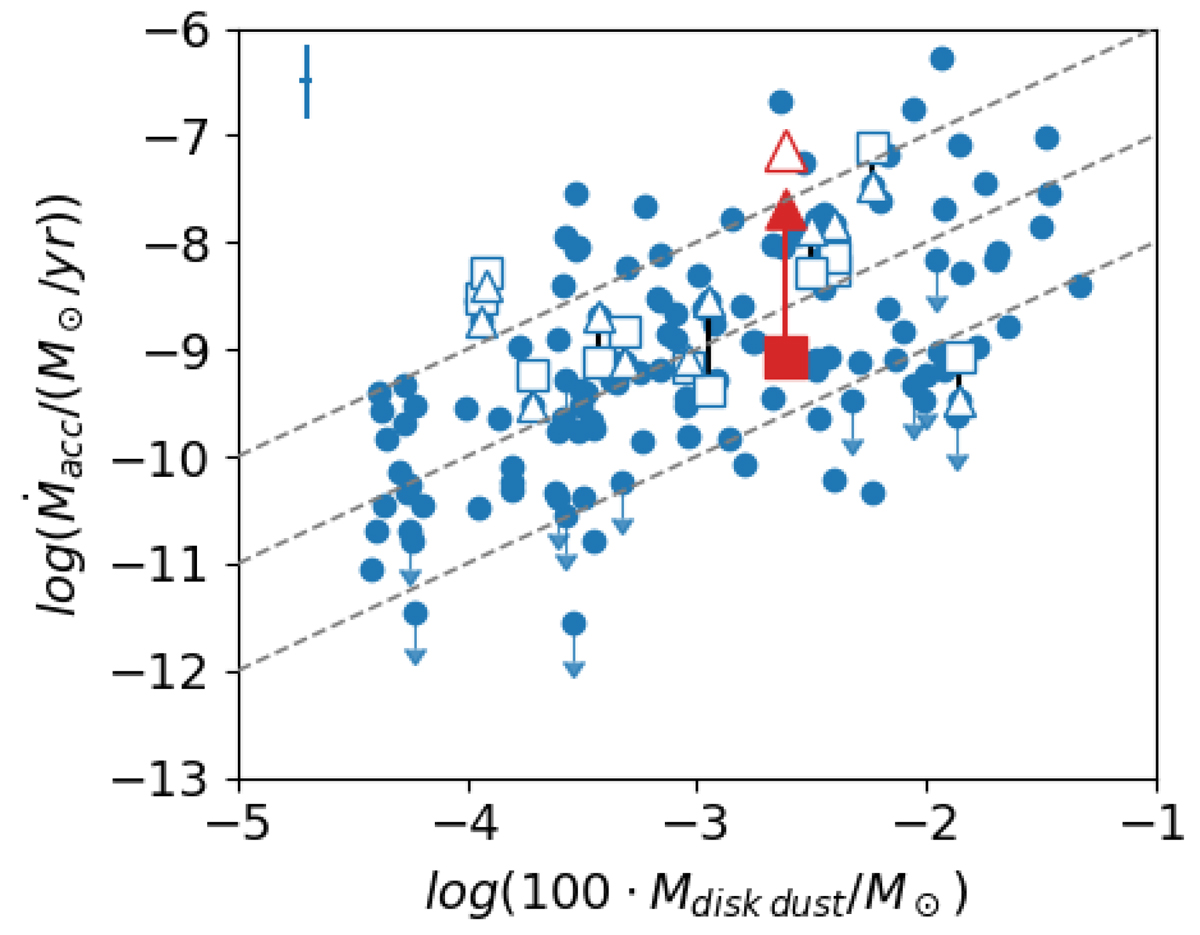
Measured Ṁacc and Mdisk for targets in the Lupus and Chamaeleon I star-forming regions (blue filled dots). The red filled (empty) triangle and square indicate the 2010* (2010) and 2021 mass accretion rates of XX Cha, respectively. The dashed lines display the Mdisk/Ṁacc ratio of 0.1, 1, and 10 Myr, respectively. The white empty squares and triangles indicate targets observed in 2021 in the PENELLOPE program (Manara et al. 2021) and around 2010, respectively.
Current usage metrics show cumulative count of Article Views (full-text article views including HTML views, PDF and ePub downloads, according to the available data) and Abstracts Views on Vision4Press platform.
Data correspond to usage on the plateform after 2015. The current usage metrics is available 48-96 hours after online publication and is updated daily on week days.
Initial download of the metrics may take a while.


