Fig. 1.
Download original image
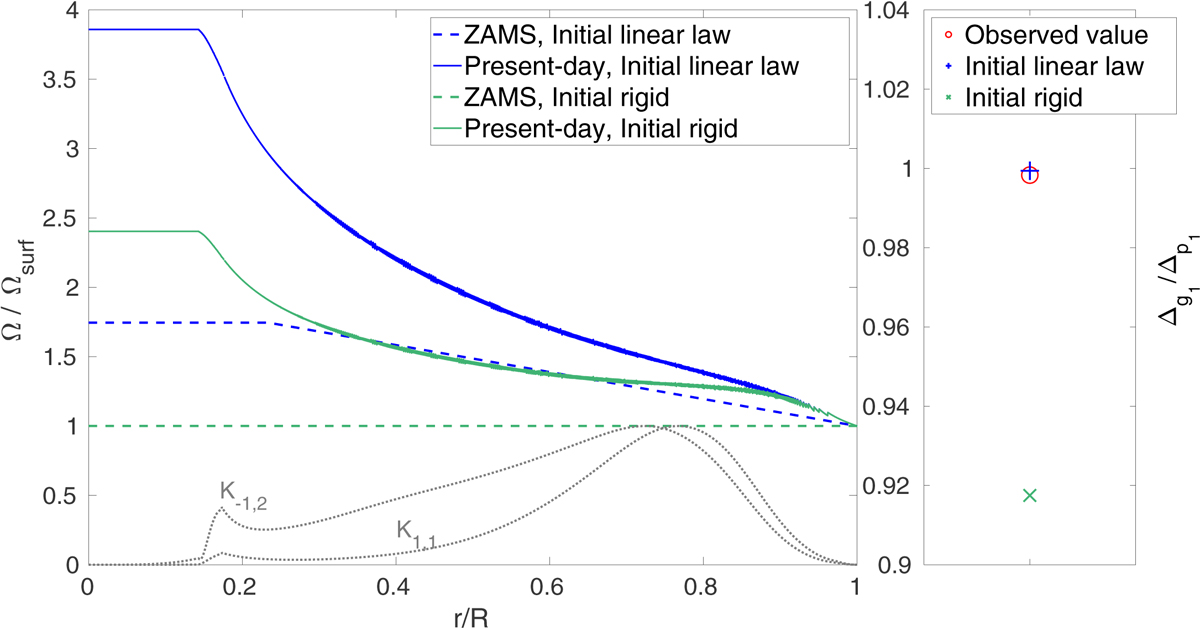
Normalised profiles of rotation in the CLES model of HD 129929 (solid lines) as a function of the normalised radius. The profiles are those that best fit the observed rotational splittings, assuming a rigid (green) or linear (blue) law on the ZAMS and local AM conservation during evolution. The related ZAMS profiles (corresponding to the minimums in χ2 shown in Fig. 2) are shown with dashed lines. The normalised rotational kernels of the p1 and g1 modes are represented by the grey dotted lines. The right insert shows a comparison of the splitting ratio between the observed value (red) and these best-fit solutions assuming a rigid (blue) or linear (green) profile of rotation on the ZAMS.
Current usage metrics show cumulative count of Article Views (full-text article views including HTML views, PDF and ePub downloads, according to the available data) and Abstracts Views on Vision4Press platform.
Data correspond to usage on the plateform after 2015. The current usage metrics is available 48-96 hours after online publication and is updated daily on week days.
Initial download of the metrics may take a while.