Open Access
Fig. 2
Download original image
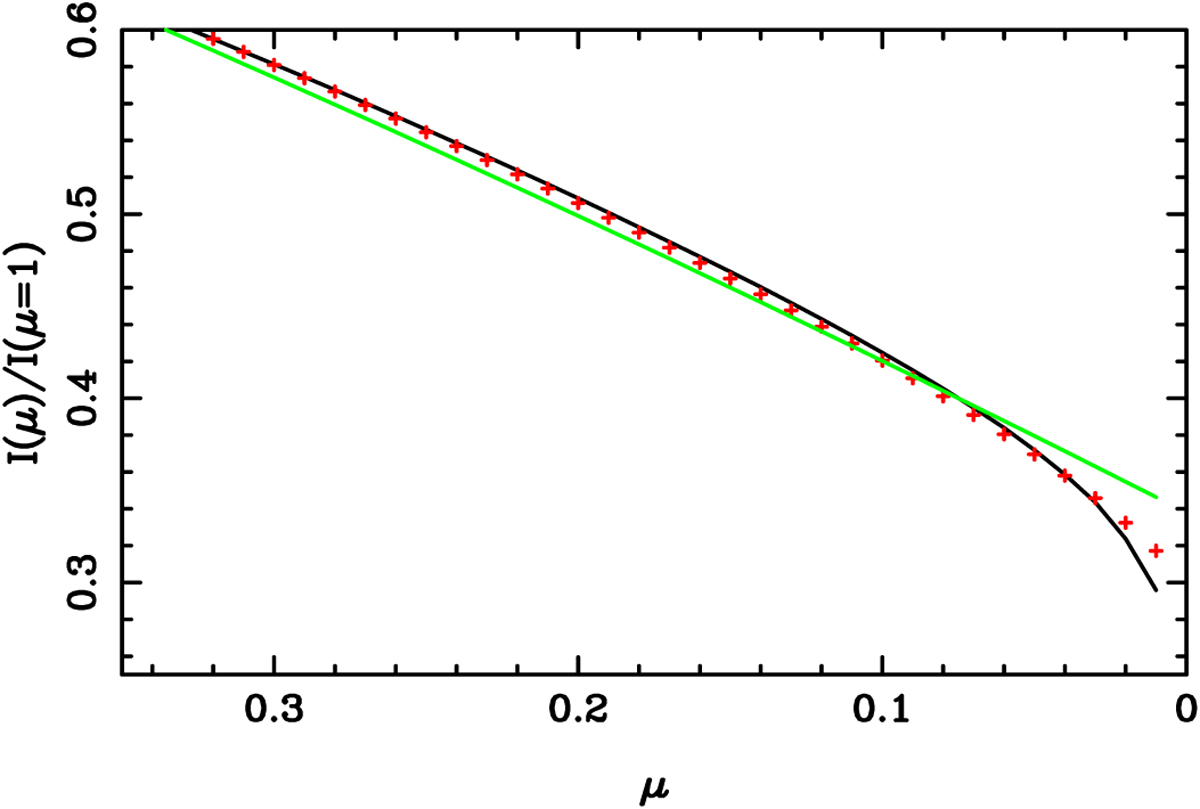
Angular distribution of the specific intensity for a model with Teff = 4500 K, log g = 5.0, [M/H] = 0.0, and Vξ = 2km s-1 for the TESS passband (black continuous line). Red crosses denote the fitting adopting the power-2 law, and the green line represents the quadratic LD law approach.
Current usage metrics show cumulative count of Article Views (full-text article views including HTML views, PDF and ePub downloads, according to the available data) and Abstracts Views on Vision4Press platform.
Data correspond to usage on the plateform after 2015. The current usage metrics is available 48-96 hours after online publication and is updated daily on week days.
Initial download of the metrics may take a while.