Fig. 5

Download original image
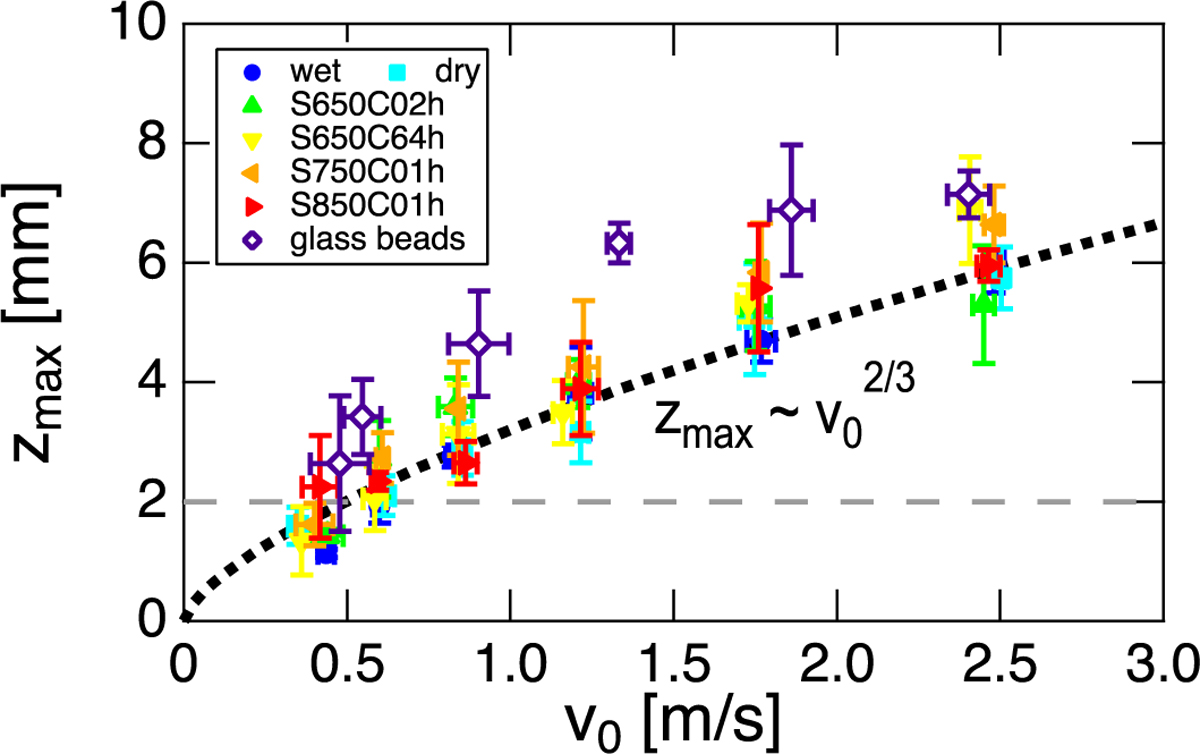
Maximum penetration depth zmax vs. impact velocity v0 for various granular targets listed in the legend and Table 1. The error bars indicate the standard deviation of five experimental runs. The dashed black line indicates the power-law relation ![]() , as a guide to the eye. The data whose zmax is less than the smallest grain diameter of 2 mm (shown by the dashed gray line) are not used in the following drag force analysis.
, as a guide to the eye. The data whose zmax is less than the smallest grain diameter of 2 mm (shown by the dashed gray line) are not used in the following drag force analysis.
Current usage metrics show cumulative count of Article Views (full-text article views including HTML views, PDF and ePub downloads, according to the available data) and Abstracts Views on Vision4Press platform.
Data correspond to usage on the plateform after 2015. The current usage metrics is available 48-96 hours after online publication and is updated daily on week days.
Initial download of the metrics may take a while.


