Fig. 1

Download original image
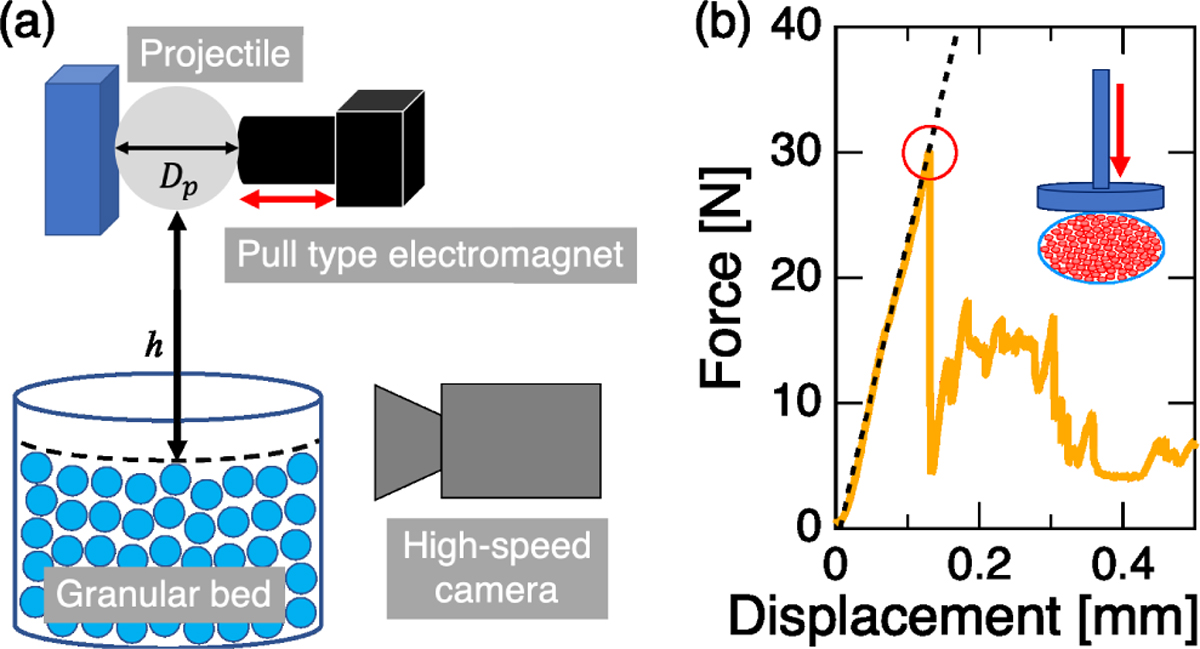
Experimental setup for the impact and an example data of grain compression test. (a) Experimental setup of the free-fall impact of a solid sphere dropped onto a granular target bed. (b) A typical force curve of the uniaxial compression test of a porous (fragile) grain (S705C01h). In the very early stage of the compression, the compression force linearly increases with displacement (black dashed line). Then, the compression force suddenly decreases at the yielding point (red circle). The peak compression force Fpeak at the yielding point (red circle) divided by the grains’ cross-sectional area is defined as the grain strength Yg. The compression is schematically drawn in the inset.
Current usage metrics show cumulative count of Article Views (full-text article views including HTML views, PDF and ePub downloads, according to the available data) and Abstracts Views on Vision4Press platform.
Data correspond to usage on the plateform after 2015. The current usage metrics is available 48-96 hours after online publication and is updated daily on week days.
Initial download of the metrics may take a while.


