Fig. 5.
Download original image
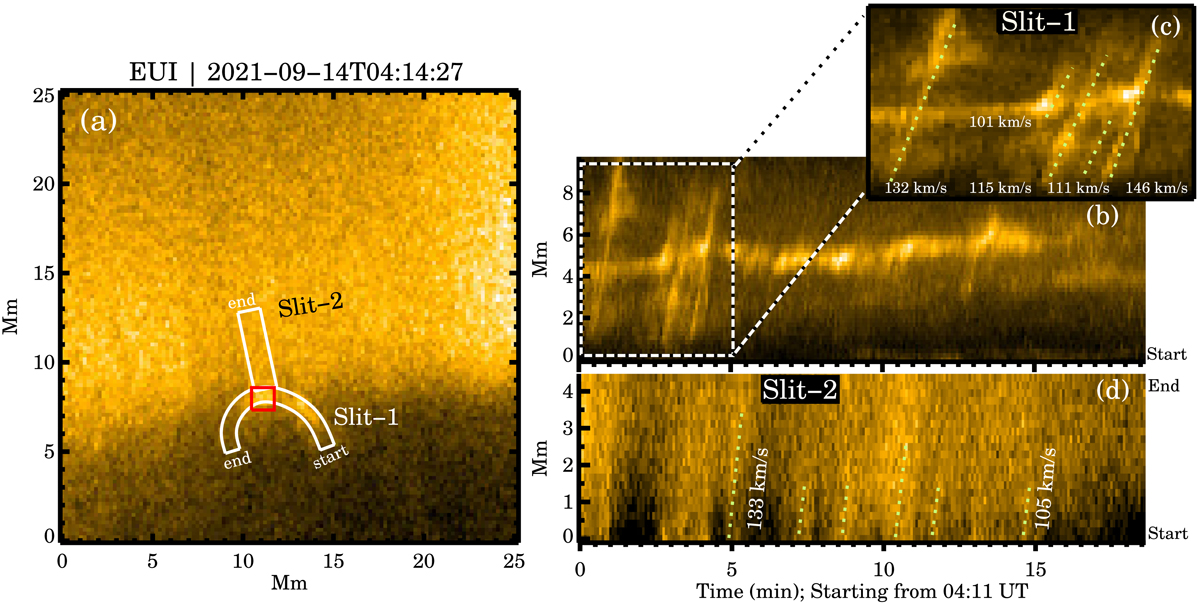
X-T analysis using the EUI image sequence. Panel a: a context image from EUI with the two artificial slits (white boxes) overplotted. Panel b: X-T map from Slit 1. A zoomed-in view of the first 5 min of this map is shown separately as panel c. The X-T map from Slit 2 is shown in panel d. Dotted lines in green trace the slanted ridges in the corresponding X-T maps and the speeds, derived from the slopes of two of these lines, are printed next to those lines. The red box in i marks the location at which the light curve was extracted for the wavelet analysis in Fig. 6. See Sect. 3.3.2 for a detailed discussion.
Current usage metrics show cumulative count of Article Views (full-text article views including HTML views, PDF and ePub downloads, according to the available data) and Abstracts Views on Vision4Press platform.
Data correspond to usage on the plateform after 2015. The current usage metrics is available 48-96 hours after online publication and is updated daily on week days.
Initial download of the metrics may take a while.