Fig. 8
Download original image
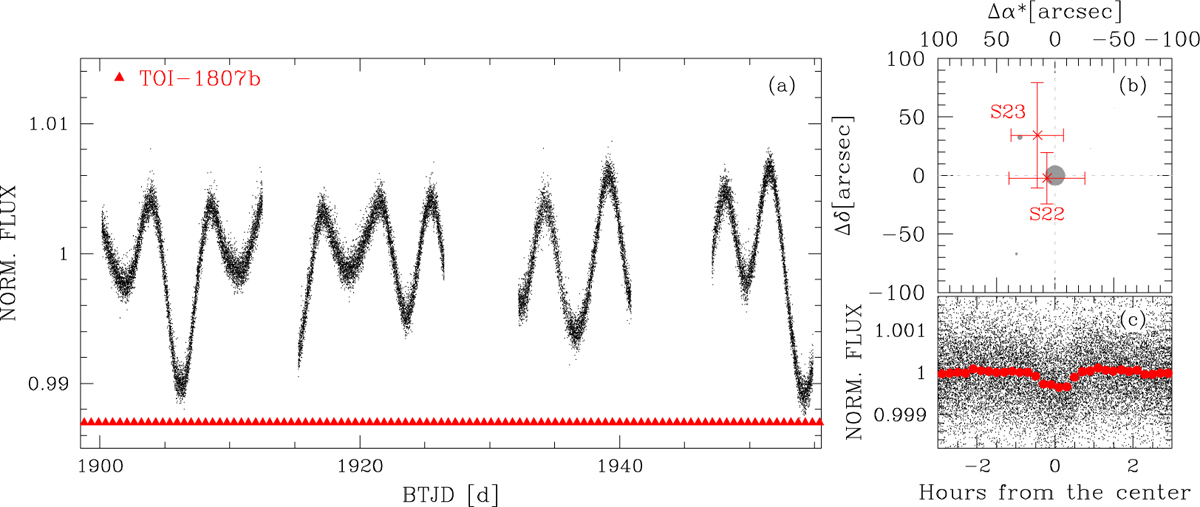
Overview of some validation tests of TOI-1807 b. Panel a shows the flux normalized short-cadence light curve of TOI-1807; red triangles indicate the central time of the TOI-1807 b’s transits. Panel b illustrates the in- or out-of-transit centroid test, for sectors 22 and 23; within the errors, the transits are associated with the central star. Panel c is the flattened light curve, folded with the period of TOI-1807 b (-0.549 day).
Current usage metrics show cumulative count of Article Views (full-text article views including HTML views, PDF and ePub downloads, according to the available data) and Abstracts Views on Vision4Press platform.
Data correspond to usage on the plateform after 2015. The current usage metrics is available 48-96 hours after online publication and is updated daily on week days.
Initial download of the metrics may take a while.