Fig. 6
Download original image
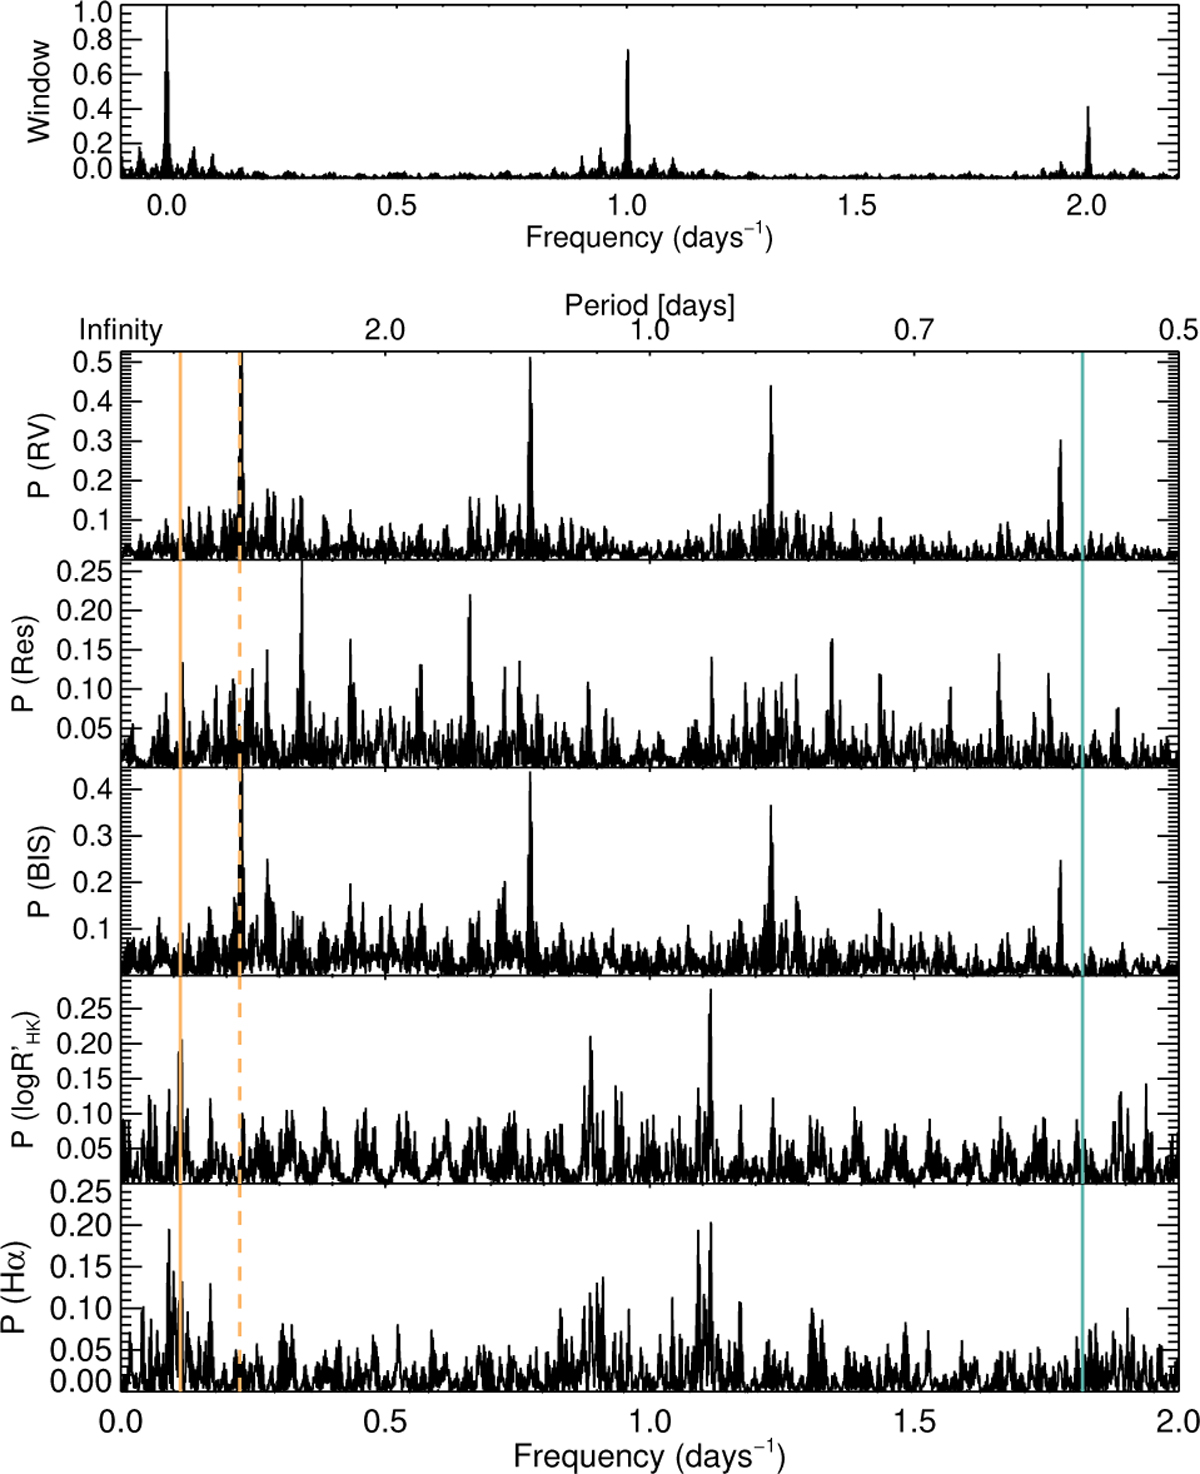
GLS periodograms of the spectroscopic time series from HARPS-N data. The window function is depicted on the top panel while the periodograms of the RVs, the corresponding residuals, the bisector, the log R′HK and the Hα time series are reported in the following panels. The orange vertical lines represent the location of the rotation period (solid) and its first harmonic (dashed), while the cyan solid line indicates the position of the planet orbital period.
Current usage metrics show cumulative count of Article Views (full-text article views including HTML views, PDF and ePub downloads, according to the available data) and Abstracts Views on Vision4Press platform.
Data correspond to usage on the plateform after 2015. The current usage metrics is available 48-96 hours after online publication and is updated daily on week days.
Initial download of the metrics may take a while.