Fig. 4
Download original image
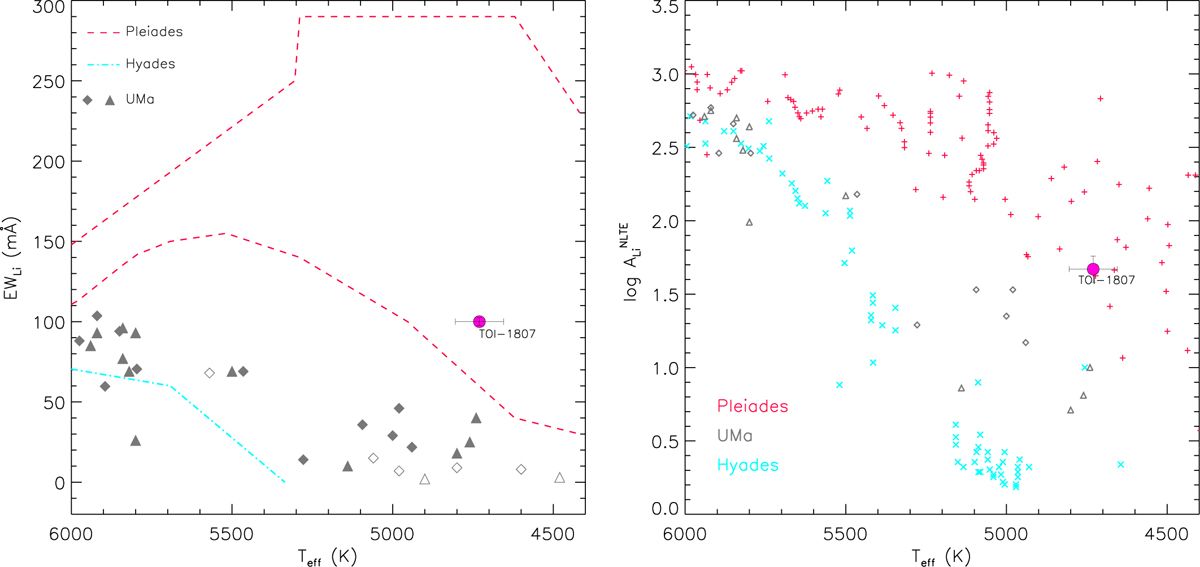
Left panel: equivalent width of the Li I λ6707.8 Å line plotted as a function of the spectroscopic effective temperature. The lines show the upper boundary for Hyades (dash-dotted; Sestito & Randich 2005) and the lower and upper envelopes of the Pleiades cluster (dashed; Soderblom et al. 1993a). The position of targets in the UMa group is represented by diamonds and triangles (open symbols are upper limits), as found by Ammler-von Eiff & Guenther (2009) and Soderblom et al. (1993b), respectively. Right panel: lithium abundance as a function of Teff. Plus, diamond, triangle, and cross symbols represent the position of targets in Pleiades, UMa, and Hyades clusters, respectively, by the same authors.
Current usage metrics show cumulative count of Article Views (full-text article views including HTML views, PDF and ePub downloads, according to the available data) and Abstracts Views on Vision4Press platform.
Data correspond to usage on the plateform after 2015. The current usage metrics is available 48-96 hours after online publication and is updated daily on week days.
Initial download of the metrics may take a while.