Fig. 13
Download original image
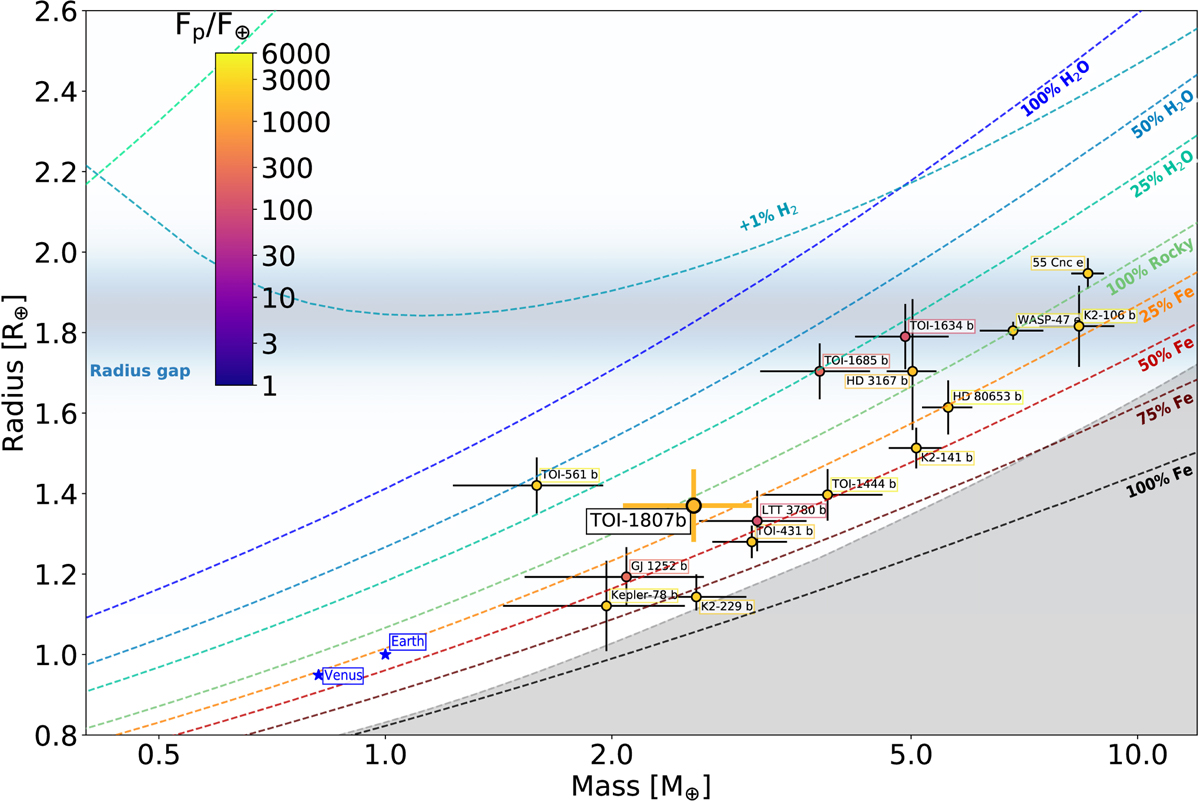
Mass-radius diagram for known ultra-short period planets with mass and radius measurements more precise than 30% and having Earth/Neptune sizes and masses. Points are color-coded according to the incidental flux (in Earth units) received by the planet. TOI-1807 b is highlighted with a larger point and thick contours. For this plot, we used the TOI-1807 b’s mass obtained in case 1. The dashed colored lines are the theoretical mass-radius curves for different chemical compositions according to Zeng et al. (2019). The shaded area represents the maximum value of iron content predicted by collisional stripping (Marcus et al. 2010). Data from The Extrasolar Planets Encyclopaedia15.
Current usage metrics show cumulative count of Article Views (full-text article views including HTML views, PDF and ePub downloads, according to the available data) and Abstracts Views on Vision4Press platform.
Data correspond to usage on the plateform after 2015. The current usage metrics is available 48-96 hours after online publication and is updated daily on week days.
Initial download of the metrics may take a while.