Fig. 12
Download original image
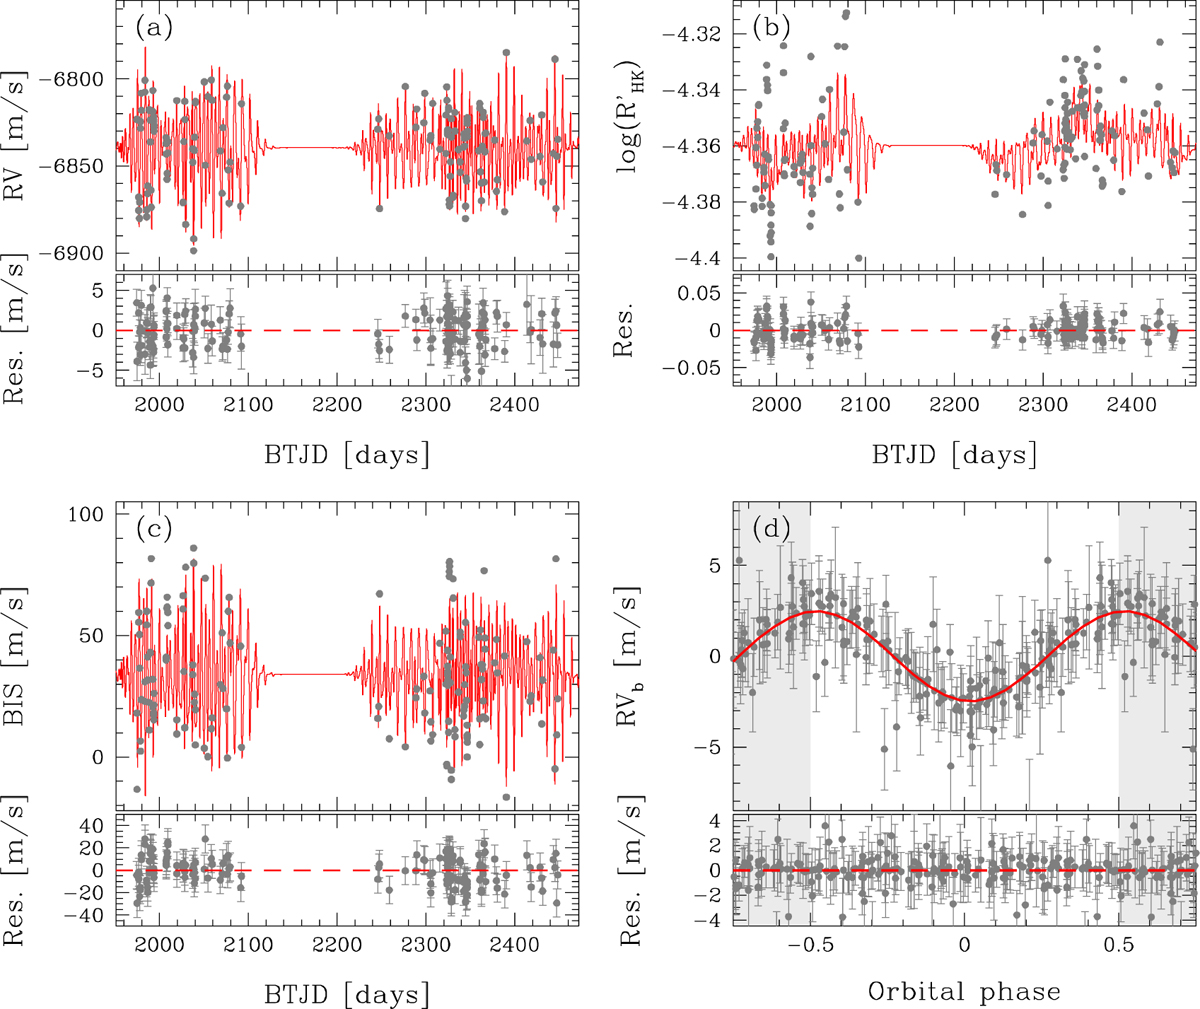
Overview of the activity+planet modeling in the spectroscopic series obtained in case 2. Panels a, b, and c show the RV, log R′HK, and BIS series, respectively (gray points). Red lines represent the models of the stellar activity obtained in the GP framework we used. The panels below report the difference between the observed points and the stellar activity models. Panel d shows the RV curve of the star after the subtraction of the stellar activity and phased with the period of TOI-1807 b; model of the RV series is reported in red; the region between the two gray shaded areas corresponds to one orbital phase.
Current usage metrics show cumulative count of Article Views (full-text article views including HTML views, PDF and ePub downloads, according to the available data) and Abstracts Views on Vision4Press platform.
Data correspond to usage on the plateform after 2015. The current usage metrics is available 48-96 hours after online publication and is updated daily on week days.
Initial download of the metrics may take a while.