Fig. 11
Download original image
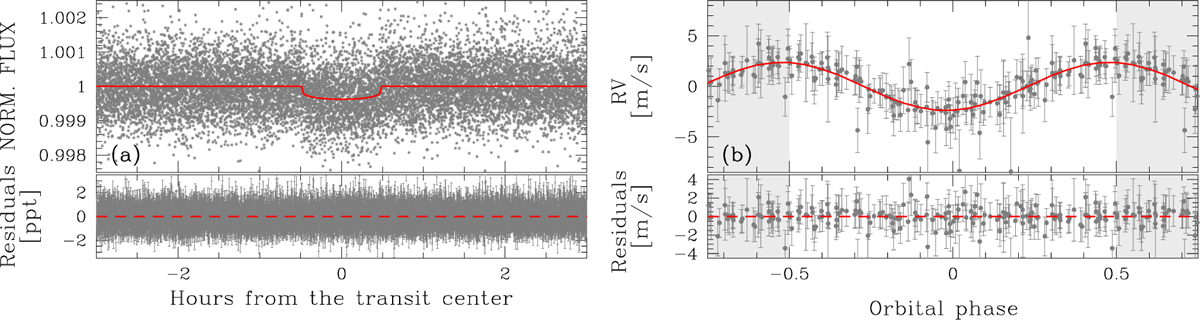
Photometric and RV modeling of TOI-1807 b planetary signal obtained in Case 1. Panel a shows the folded transits in the light curve of TOI-1807 after the subtraction of the stellar activity signal, and the model of the transits (red line). In the panel below, the residuals of the light curve after the subtraction of the planetary transit model. Panel b shows the RV curve of the star after removing the stellar activity contribution, phased with the period of TOI-1807 b; the red line represents the model used to measure the RV semi-amplitude of the curve. The region between the two gray shaded areas corresponds to one orbital phase. In the panel below the RV residuals after model subtraction are shown.
Current usage metrics show cumulative count of Article Views (full-text article views including HTML views, PDF and ePub downloads, according to the available data) and Abstracts Views on Vision4Press platform.
Data correspond to usage on the plateform after 2015. The current usage metrics is available 48-96 hours after online publication and is updated daily on week days.
Initial download of the metrics may take a while.