Fig. 10
Download original image
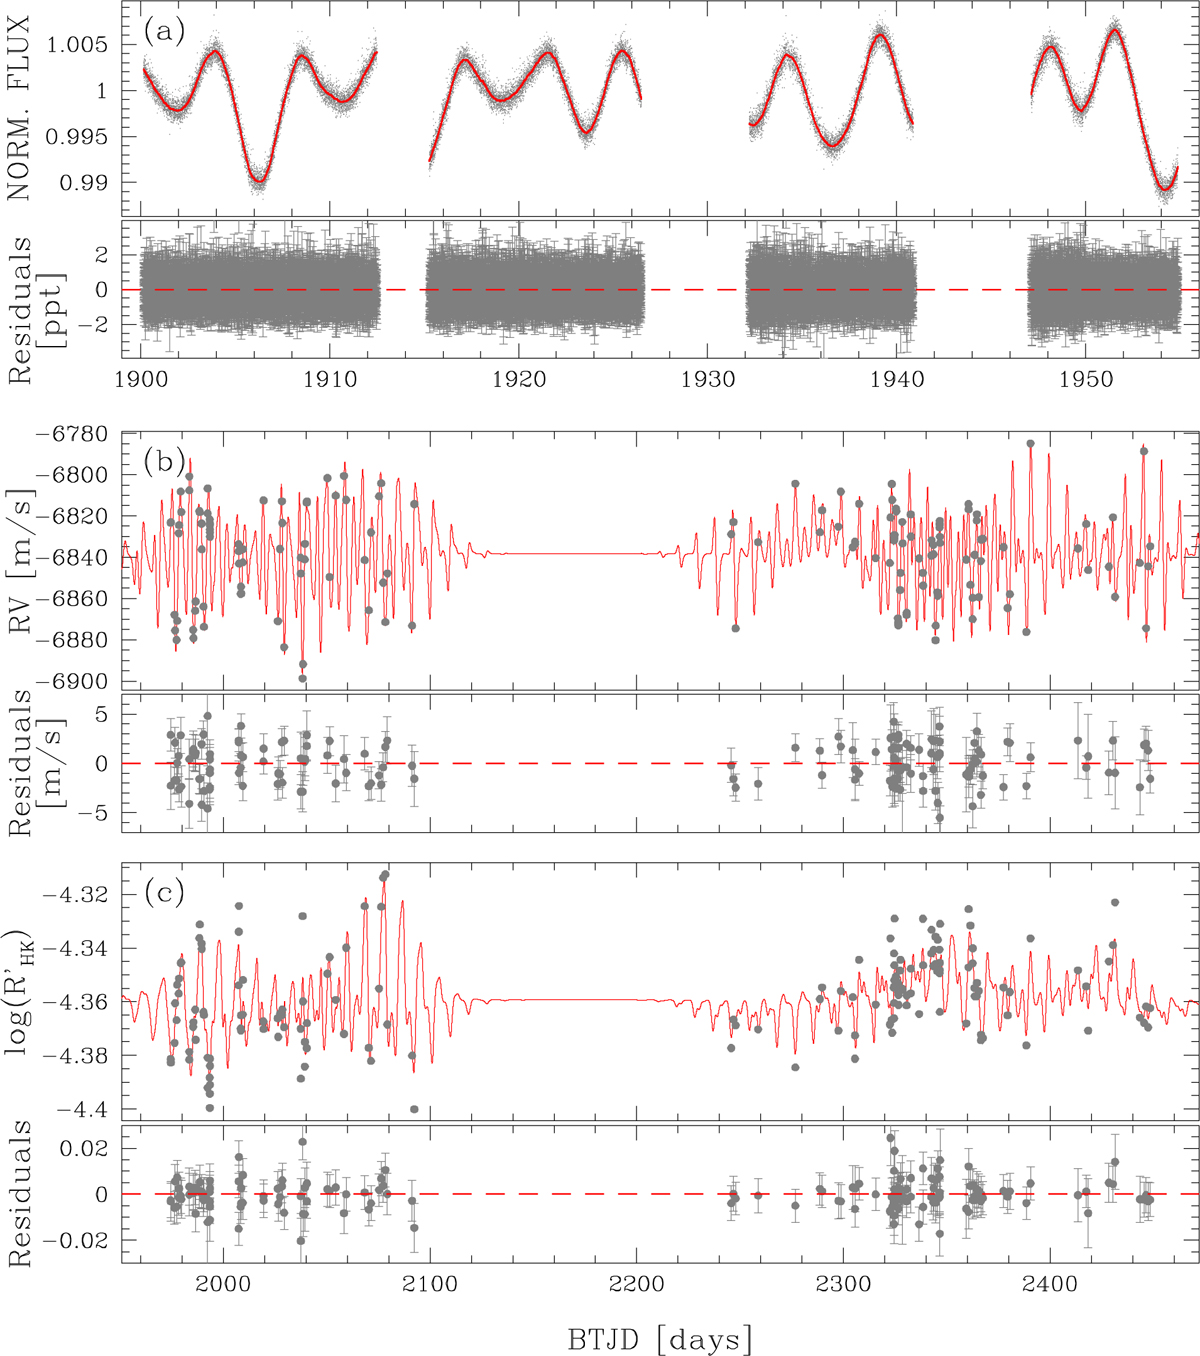
Overview of the modeling of the stellar activity performed for the Case 1. Panel a shows the light curve (in gray) of the star obtained with TESS short cadence data; the model of the activity obtained with the GP fit is reported in red. The panel below is the plot of the residuals after the subtraction of the model to the light curve. Panels b and c represent the RV and log R′HKseries of TOI-1807 (gray points): the stellar activity models are illustrated in red, while the residuals obtained after the subtraction of the model to the observed data are reported in the plots below each panel.
Current usage metrics show cumulative count of Article Views (full-text article views including HTML views, PDF and ePub downloads, according to the available data) and Abstracts Views on Vision4Press platform.
Data correspond to usage on the plateform after 2015. The current usage metrics is available 48-96 hours after online publication and is updated daily on week days.
Initial download of the metrics may take a while.