Fig. 6
Download original image
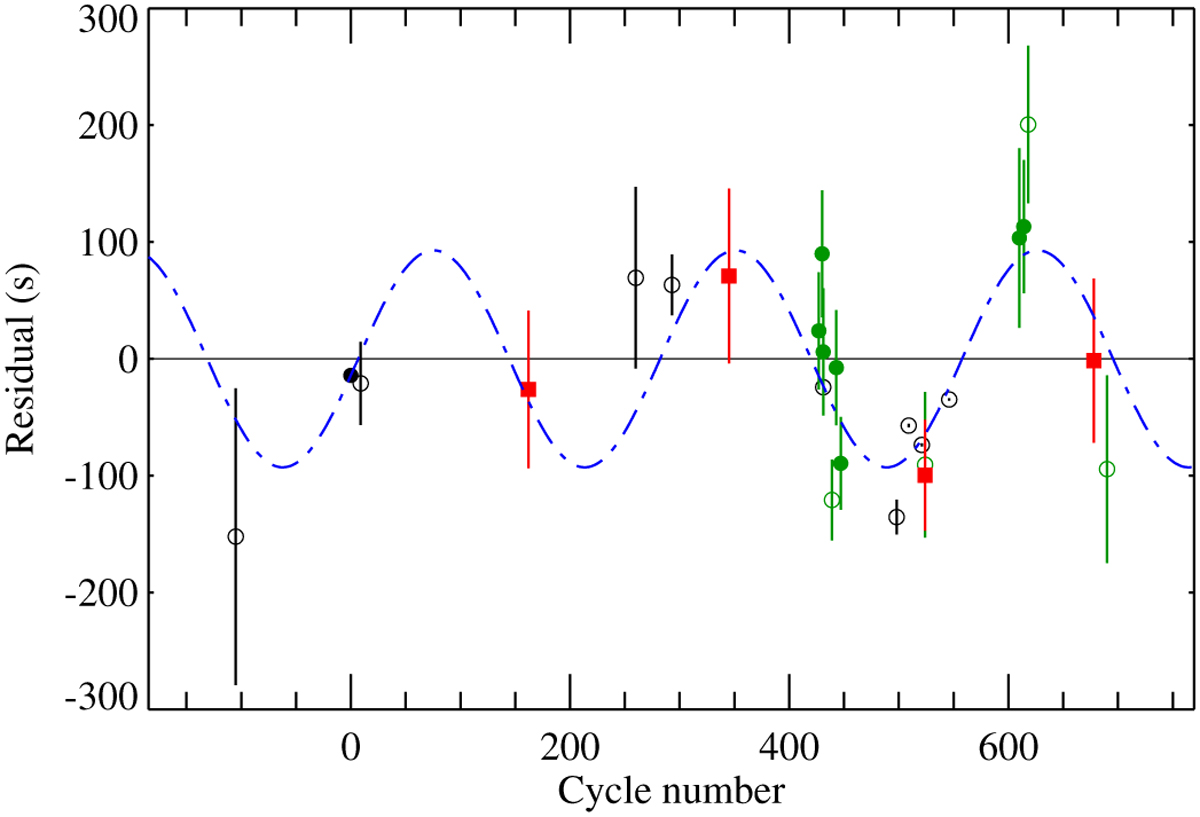
Residuals of the timings of mid-transit of HAT-P-26 b versus the linear term in the sinusoidal ephemeris. The dotted blue line shows the sine curve and the points represent the residuals of the measured transit times versus the linear term in the ephemeris. Filled green circles are data from von Essen et al. (2019), black circles are the other timings from the literature that are also reported in von Essen et al. (2019), and red squares are the new timings from this work. Empty circles refer to mid-transit times estimated from incomplete transit light curves. The errorbars of the timings coming from incomplete HST light curves were increased (see text).
Current usage metrics show cumulative count of Article Views (full-text article views including HTML views, PDF and ePub downloads, according to the available data) and Abstracts Views on Vision4Press platform.
Data correspond to usage on the plateform after 2015. The current usage metrics is available 48-96 hours after online publication and is updated daily on week days.
Initial download of the metrics may take a while.