Fig. 10
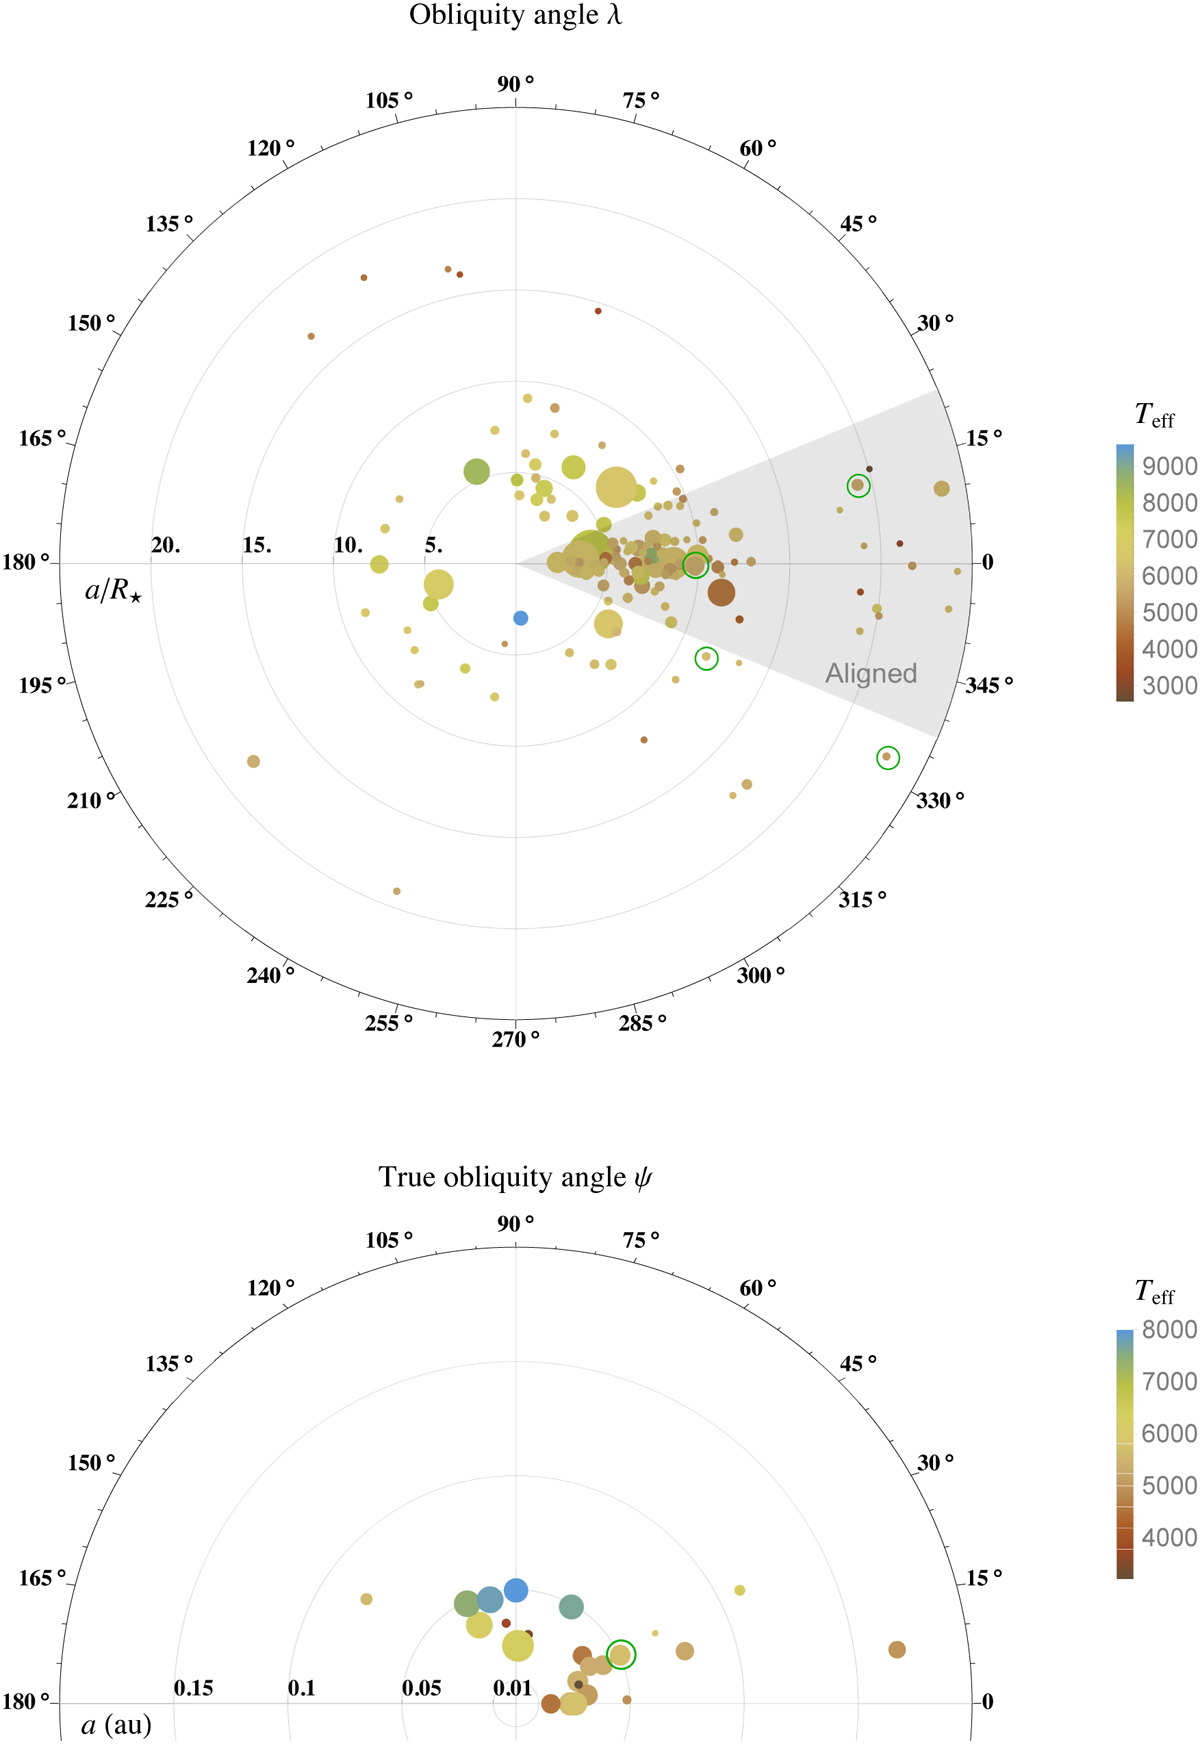
Download original image
Top panel: sky-projected orbital obliquity of known exoplanets as a function of their scaled orbital distance a/R* from the host star. The plot includes all planets with Mp < 13 MJup and a/R* < 25. They are represented by circles, whose sizes are proportional to their mass. The planets surrounded by the green circles are those examined in this work, except for HAT-P-26 b. Bottom panel: true orbital obliquity of known exoplanets. They are represented by circles, whose size are proportional to their radius. The planet surrounded by the green circle is HAT-P-21 b., which was examined in this work. Both panels: the error bars have been suppressed for clarity. Colour indicates the effective temperature of their parent stars. The data were taken from TEPCat in February 2022. Figure inspired by similar plots from J. Winn; see also Zhou et al. (2019).
Current usage metrics show cumulative count of Article Views (full-text article views including HTML views, PDF and ePub downloads, according to the available data) and Abstracts Views on Vision4Press platform.
Data correspond to usage on the plateform after 2015. The current usage metrics is available 48-96 hours after online publication and is updated daily on week days.
Initial download of the metrics may take a while.