Fig. 1
Download original image
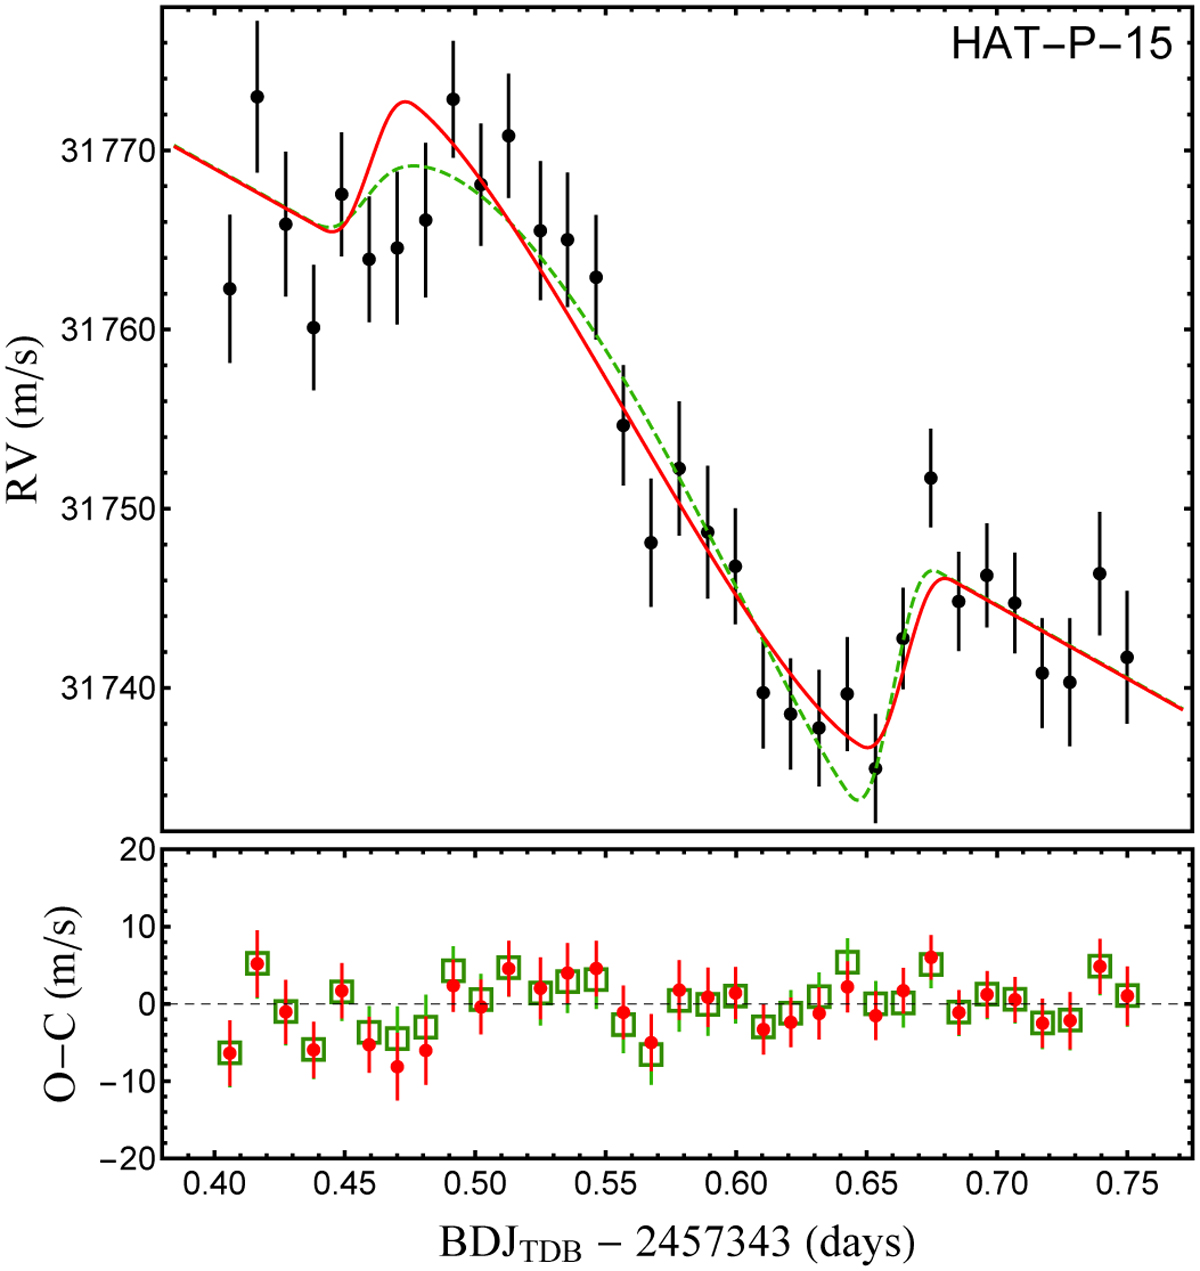
RV data of the transit of HAT-P-15 b observed with HARPS-N. Superimposed are the best-fitting RV-curve models (the red line does not include the modelling of the stellar convective blueshift (CB) effect, while the green-dashed line does). The corresponding residuals are plotted in the lower panel. For clarity, the error bars are displayed only for the model without the CB effect. See the discussion in Sect. 8.2
Current usage metrics show cumulative count of Article Views (full-text article views including HTML views, PDF and ePub downloads, according to the available data) and Abstracts Views on Vision4Press platform.
Data correspond to usage on the plateform after 2015. The current usage metrics is available 48-96 hours after online publication and is updated daily on week days.
Initial download of the metrics may take a while.