Fig. 8
Download original image
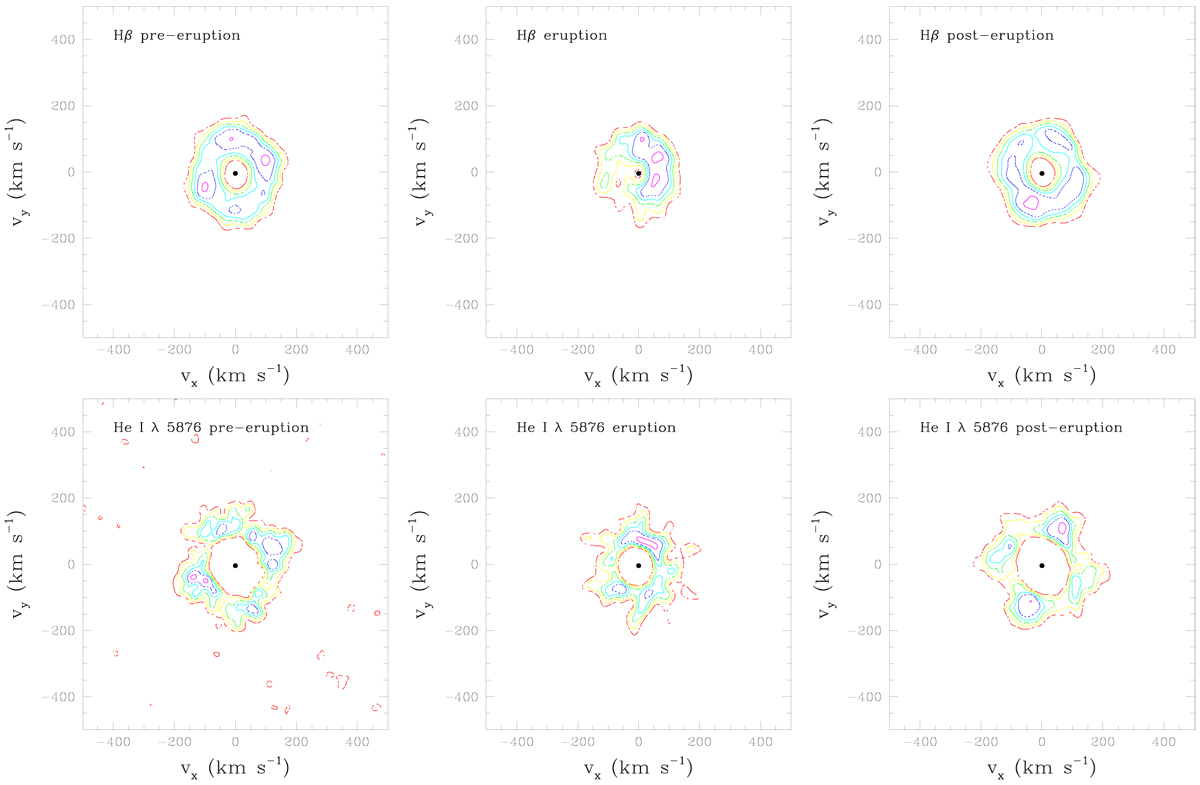
Doppler maps of the Hβ (top row) and He I λ 5876 (bottom row) lines. From left to right the different maps correspond to the pre-eruption, eruption, and post-eruption epochs. The contours correspond to 95 (magenta), 80 (blue), 70 (cyan), 60 (green), 50 (yellow), and 40% (red) of the value of the highest peak in the map. No correction for the photospheric absorption component was applied.
Current usage metrics show cumulative count of Article Views (full-text article views including HTML views, PDF and ePub downloads, according to the available data) and Abstracts Views on Vision4Press platform.
Data correspond to usage on the plateform after 2015. The current usage metrics is available 48-96 hours after online publication and is updated daily on week days.
Initial download of the metrics may take a while.