Fig. 7
Download original image
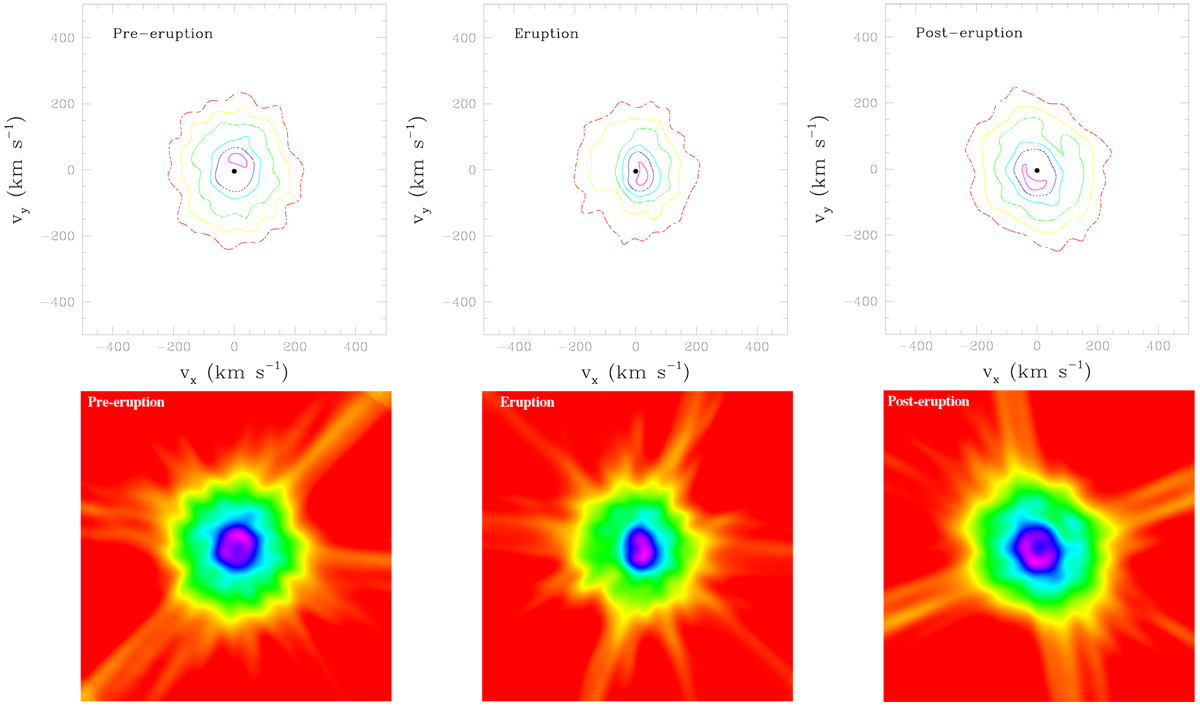
Doppler maps of the Hα emission. From left to right the different maps correspond to the pre-eruption, eruption, and post-eruption epochs. For each epoch, the top panel illustrates the map with contours corresponding to 95 (magenta), 80 (blue), 65 (cyan), 50 (green), 35 (yellow), and 20% (red) of the value of the highest peak in the map. The black dot corresponds to the orbital motion of the Be star with KBe = 4.3 km s−1. The bottom panel illustrates the same map as a colour plot.
Current usage metrics show cumulative count of Article Views (full-text article views including HTML views, PDF and ePub downloads, according to the available data) and Abstracts Views on Vision4Press platform.
Data correspond to usage on the plateform after 2015. The current usage metrics is available 48-96 hours after online publication and is updated daily on week days.
Initial download of the metrics may take a while.