Fig. 6
Download original image
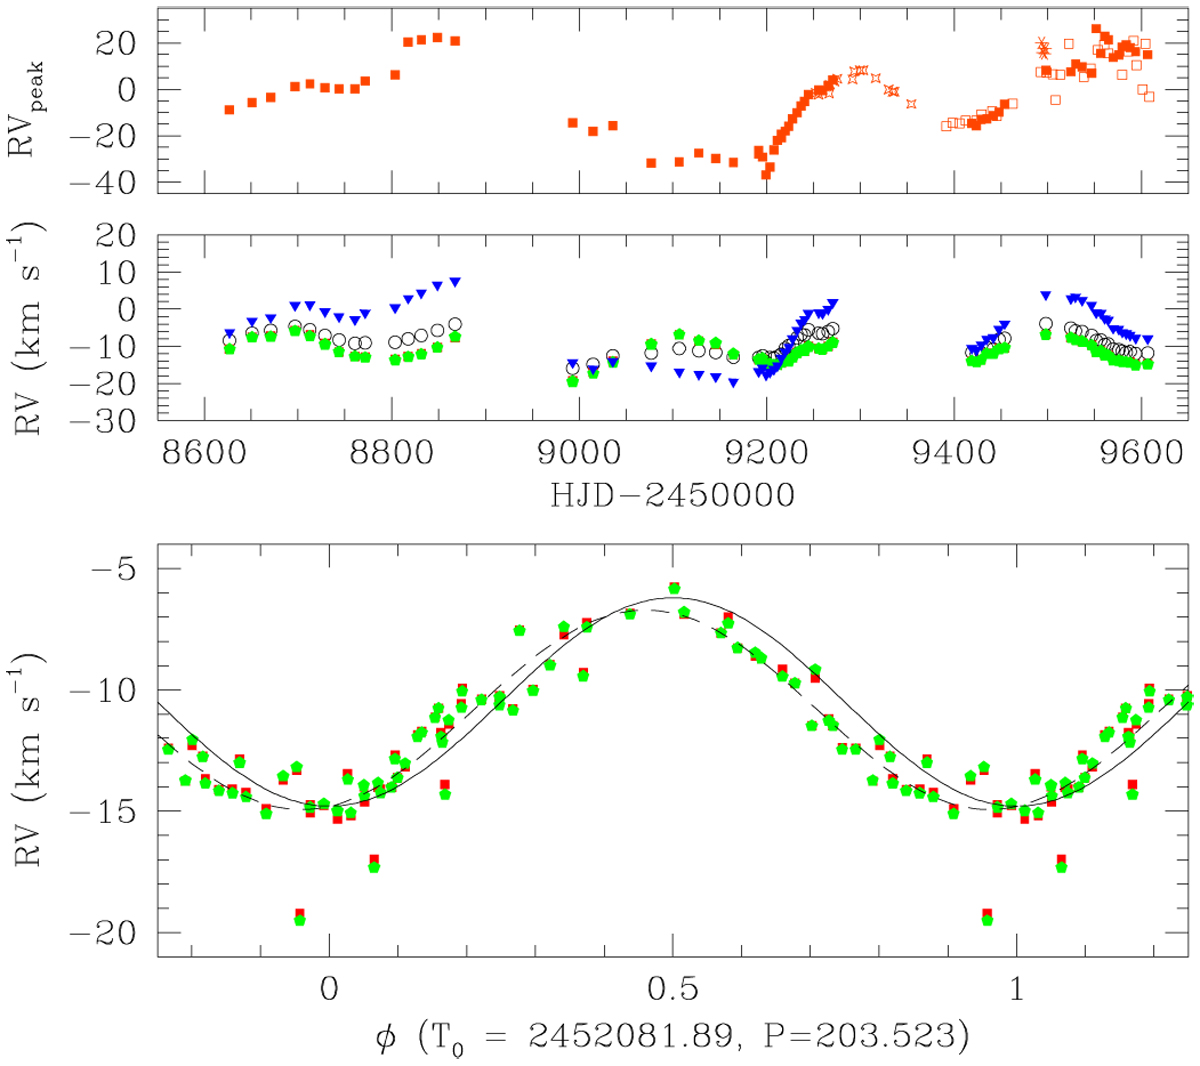
RVs of the Hα line of γ Cas during the 2020–2022 monitoring campaign. Top panel: RVs of the Hα emission peak. Middle panel: overall RVs as a function of time. The different symbols stand for the methods used to determine the overall RVs: open dots represent first-order moment; red squares the mirror profile; green pentagons the correlation with a two-Gaussian function; and blue triangles the correlation with the February 19, 2021, spectrum. Bottom panel: RVs from the mirror profile and the correlation with two-Gaussian function methods as a function of orbital phase computed with the ephemerides of solution number 5 of Nemravová et al. (2012). The solid line in the bottom panel yields the RV curve of Nemravová et al. (2012) with a systemic velocity set to –10.5 kms−1, whilst the dashed line corresponds to the best-fit orbital solution obtained from our RVs (see the main text and Table 2). The symbols have the same meaning as in the middle panel.
Current usage metrics show cumulative count of Article Views (full-text article views including HTML views, PDF and ePub downloads, according to the available data) and Abstracts Views on Vision4Press platform.
Data correspond to usage on the plateform after 2015. The current usage metrics is available 48-96 hours after online publication and is updated daily on week days.
Initial download of the metrics may take a while.