Fig. 3
Download original image
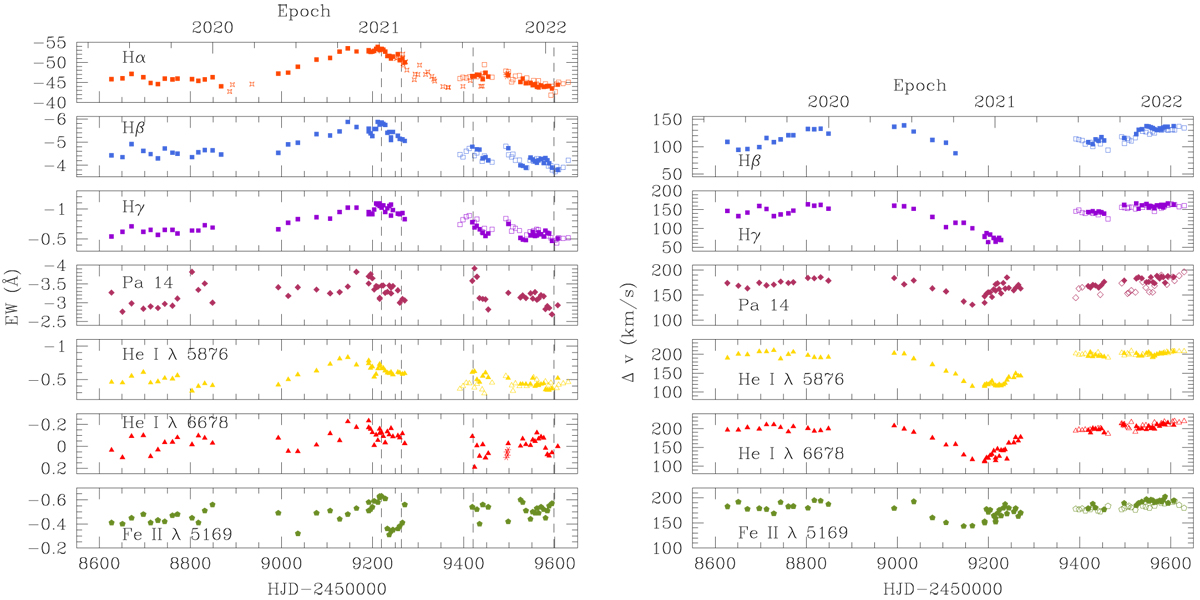
Results from the optical monitoring of γ Cas. Left panel illustrates the EWs of various prominent lines as a function of time, whilst the right panel yields the RV separation of the double-peaked profiles. The dashed vertical lines in the EW plots correspond to the dates of the new XMM-Newton observations. Filled and open symbols identify TIGRE data and spectra collected by co-author JGF, respectively. Asterisks (Hα and He I λ 6678 panels) correspond to Aurélie data, and four-point stars (Hα panel) refer to BeSS archival spectra.
Current usage metrics show cumulative count of Article Views (full-text article views including HTML views, PDF and ePub downloads, according to the available data) and Abstracts Views on Vision4Press platform.
Data correspond to usage on the plateform after 2015. The current usage metrics is available 48-96 hours after online publication and is updated daily on week days.
Initial download of the metrics may take a while.