Fig. 16
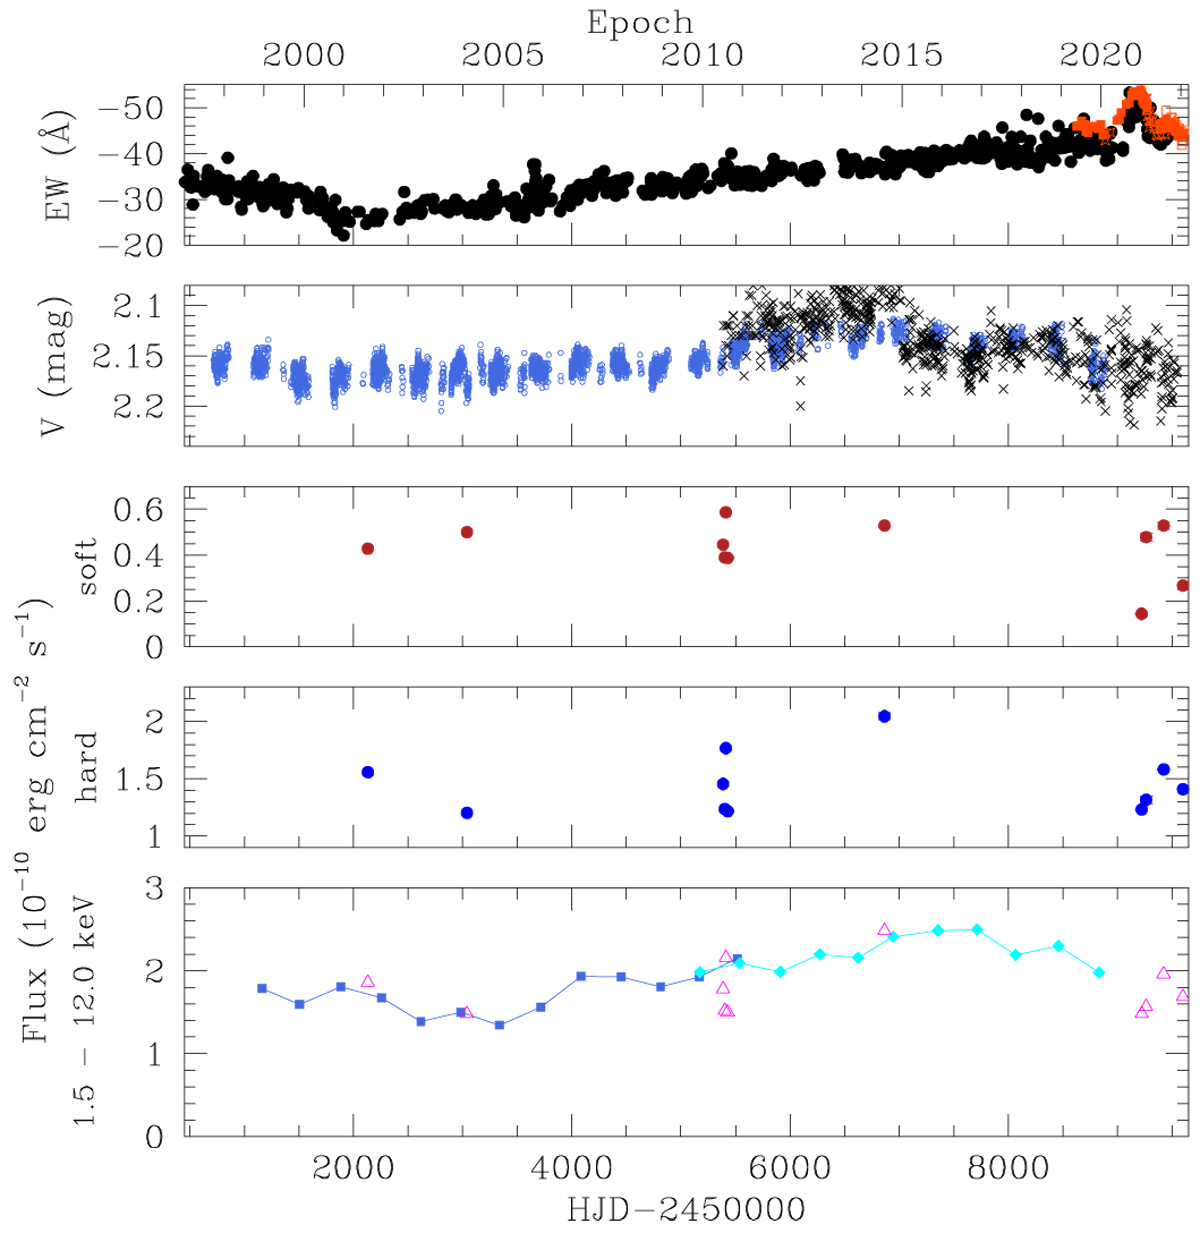
Download original image
Long-term view of the variations in γ Cas. Top panel: longterm behaviour of EW(Hα) with data from Pollmann et al. (2014) in black and data from the present study in orange. Second panel: APT V-band photometry (blue open circles) and the V-band photometry by AAVSO observer Wolfgang Vollmann (black crosses). Third and fourth panels: observed soft and hard X-ray fluxes inferred from Chandra and XMM-Newton spectra (see Table 4). Finally, the bottom panel yields the evolution of the 1.5–12 keV X-ray flux of γ Cas, averaged over the yearly observing seasons as in Fig. 15. The fluxes in the same band derived from the Chandra and XMM-Newton observations (Table 4) are illustrated by the magenta triangles.
Current usage metrics show cumulative count of Article Views (full-text article views including HTML views, PDF and ePub downloads, according to the available data) and Abstracts Views on Vision4Press platform.
Data correspond to usage on the plateform after 2015. The current usage metrics is available 48-96 hours after online publication and is updated daily on week days.
Initial download of the metrics may take a while.