Fig. 15
Download original image
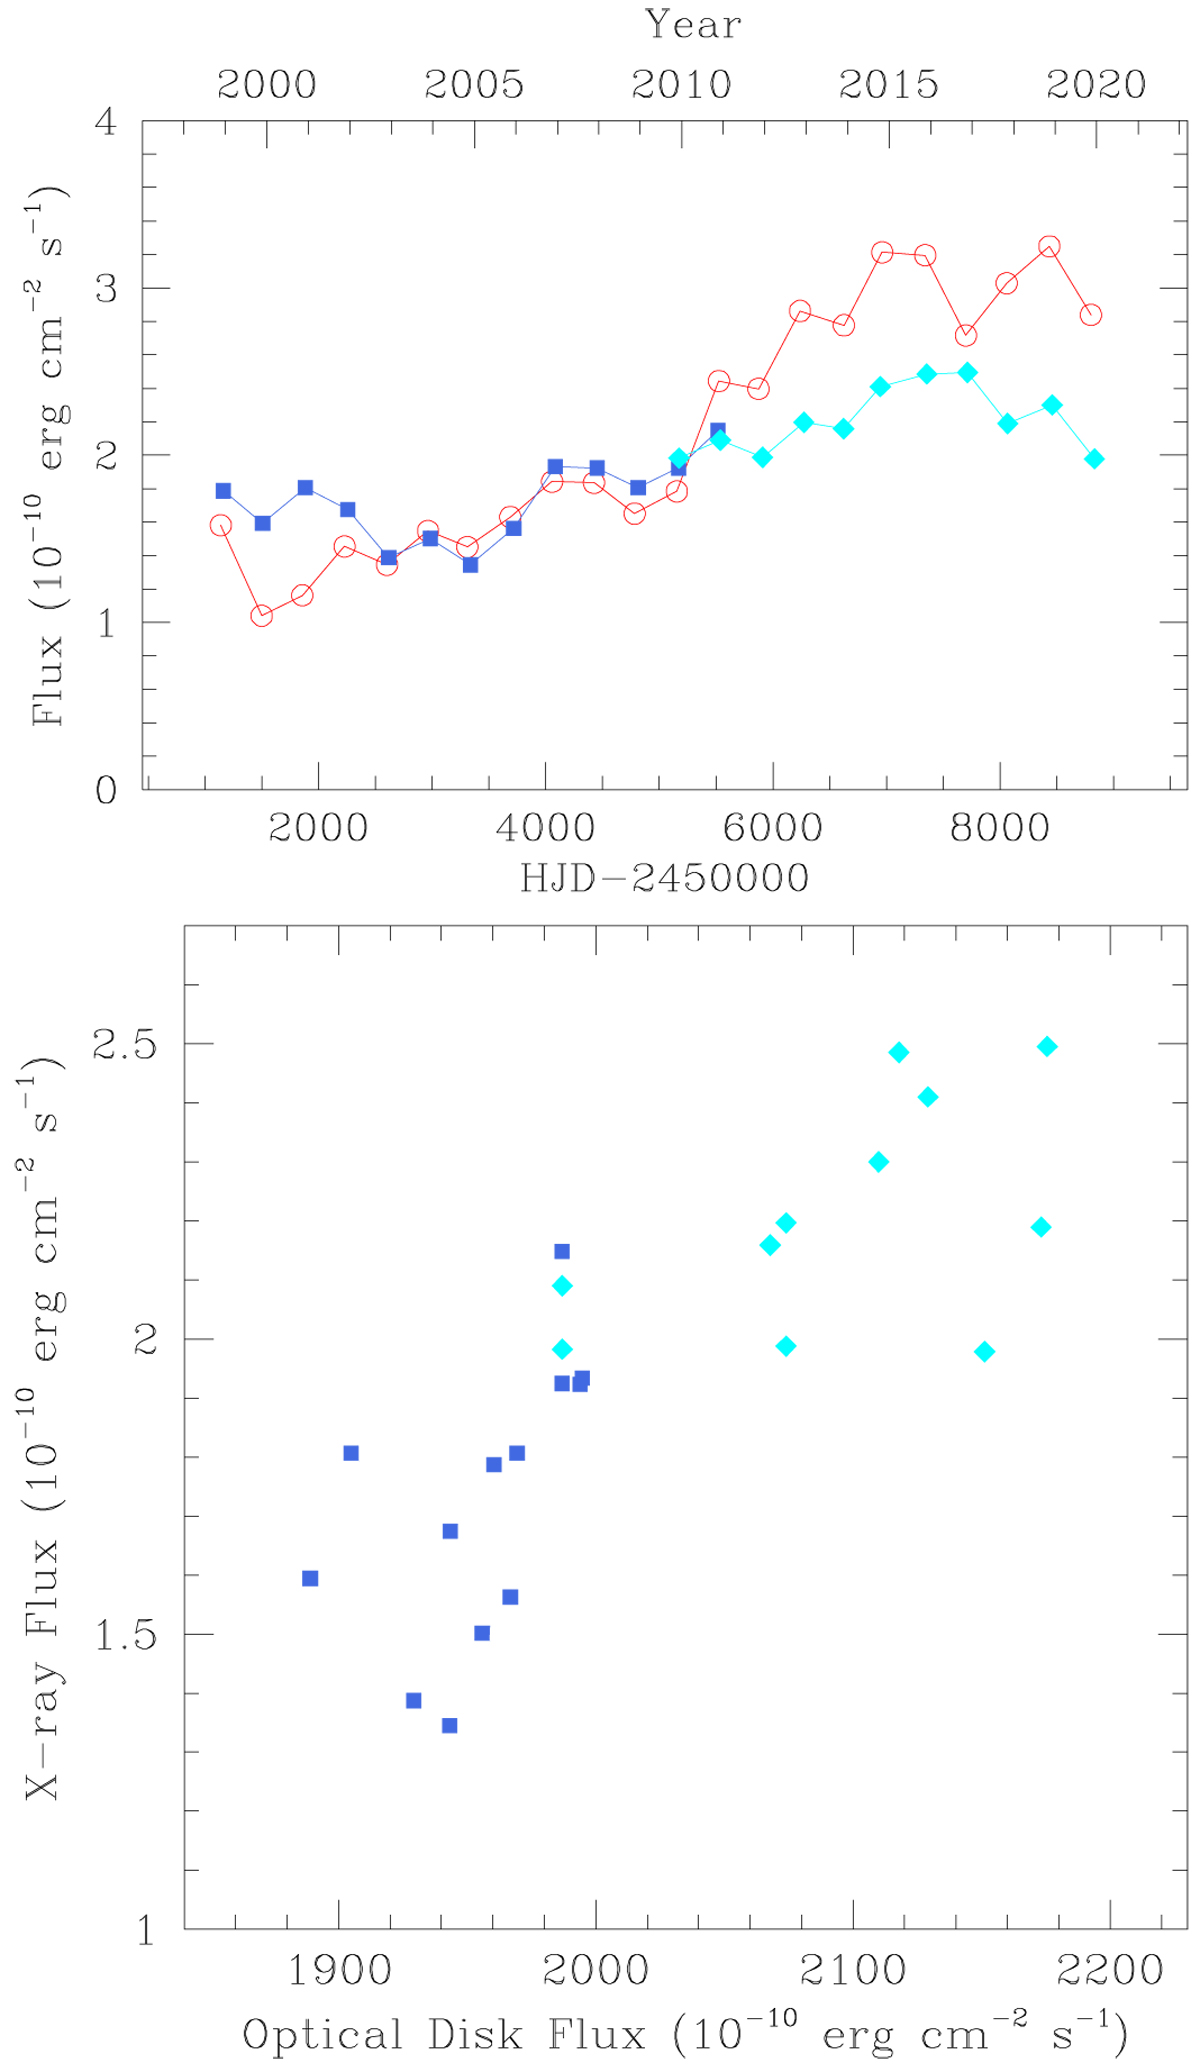
Long-term evolution of the X-ray fluxes and V-band disc fluxes of γ Cas. Top panel: evolution of the X-ray flux of γ Cas, averaged over the yearly APT observing seasons. The blue squares correspond to the ASM data, and the cyan diamonds correspond to the scaled MAXI fluxes (see the main text). The red open circles indicate the yearly averages of the APT V-band flux corrected for the stellar emission and scaled down according to Eq. (5) (see the main text). Bottom panel: yearly averaged X-ray fluxes as a function of near-contemporaneous APT V-band fluxes corrected for the stellar photospheric emission. The symbols have the same meaning as in the top panel.
Current usage metrics show cumulative count of Article Views (full-text article views including HTML views, PDF and ePub downloads, according to the available data) and Abstracts Views on Vision4Press platform.
Data correspond to usage on the plateform after 2015. The current usage metrics is available 48-96 hours after online publication and is updated daily on week days.
Initial download of the metrics may take a while.