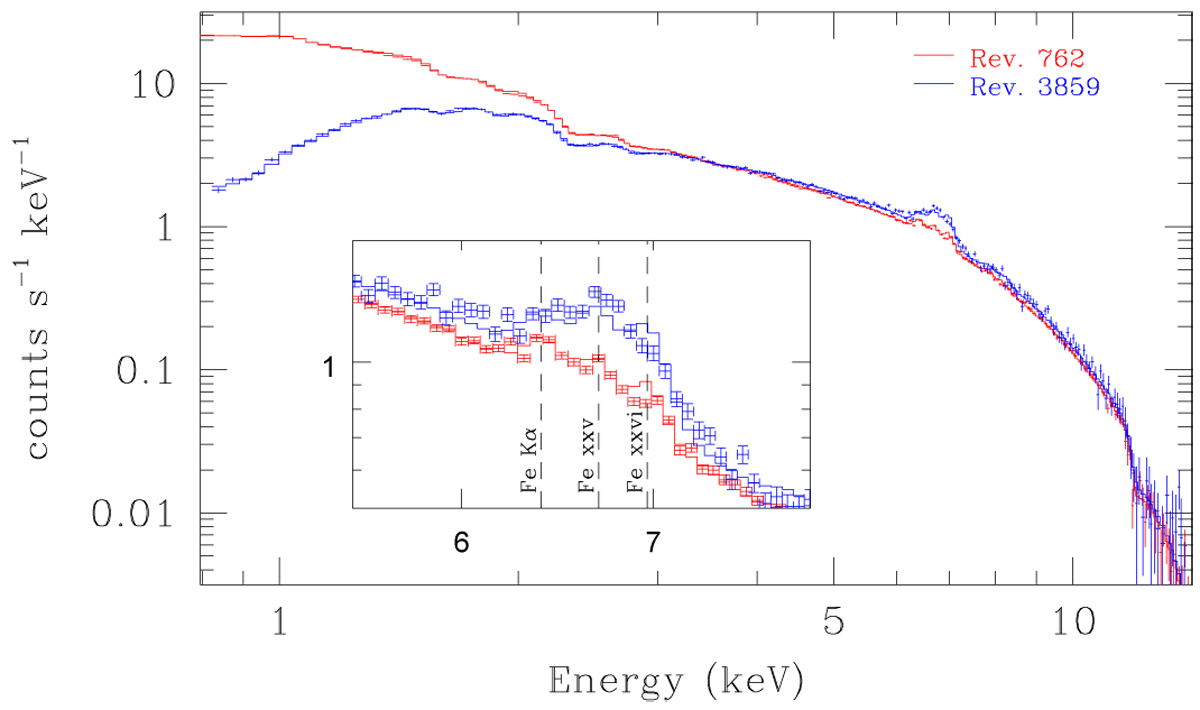
Fig. 12
Download original image
Comparison between the EPIC-pn data and the best-fit models for revolutions 0762 (February 2004, red) and 3859 (January 2021, blue). Only the EPIC-pn data are shown for clarity, although all EPIC and RGS spectra were fitted simultaneously. Note the strong attenuation of the January 2021 spectrum in the soft energy range that is also seen in the top panel of Fig. 11 and discussed in Sects. 3.3.1 and 3.3.2. The insert shows a zoomed-in view of the iron line complex.
Current usage metrics show cumulative count of Article Views (full-text article views including HTML views, PDF and ePub downloads, according to the available data) and Abstracts Views on Vision4Press platform.
Data correspond to usage on the plateform after 2015. The current usage metrics is available 48-96 hours after online publication and is updated daily on week days.
Initial download of the metrics may take a while.