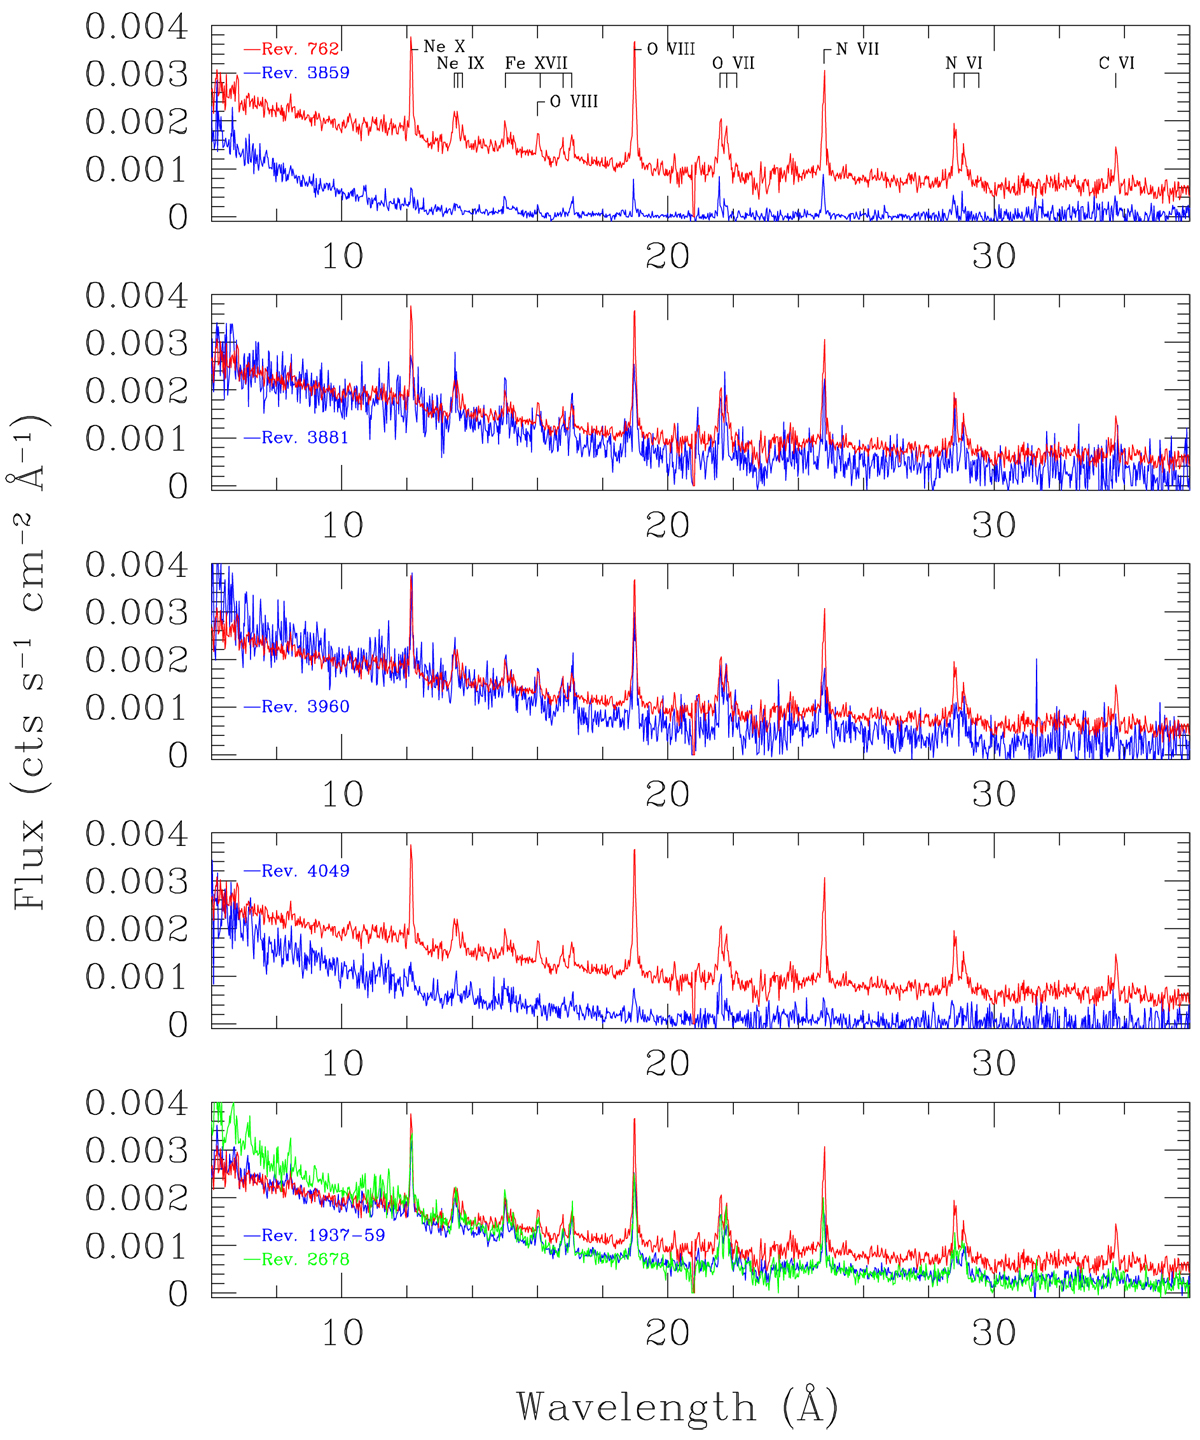
Fig. 11
Download original image
Variations in the RGS spectrum of γ Cas. In each sub-panel, the flux-calibrated RGS spectrum from revolution 762 (February 2004) is shown for comparison in red. In the four upper sub-panels, the blue curve corresponds to the data collected during the 2021–2022 campaign, respectively revolutions 3859 (January 2021), 3881 (February 2021), 3960 (July 2021), and 4049 (January 2022) for sub-panels 1–4 from the top downwards. For comparison, the blue and green curves in the lowest panel show respectively the combined RGS spectrum from the 2010 campaign (revolutions 1937–1959) and the data from July 2014 (revolution 2678). The strong suppression of the soft spectrum during revolutions 3859 and 4049 is clearly seen.
Current usage metrics show cumulative count of Article Views (full-text article views including HTML views, PDF and ePub downloads, according to the available data) and Abstracts Views on Vision4Press platform.
Data correspond to usage on the plateform after 2015. The current usage metrics is available 48-96 hours after online publication and is updated daily on week days.
Initial download of the metrics may take a while.