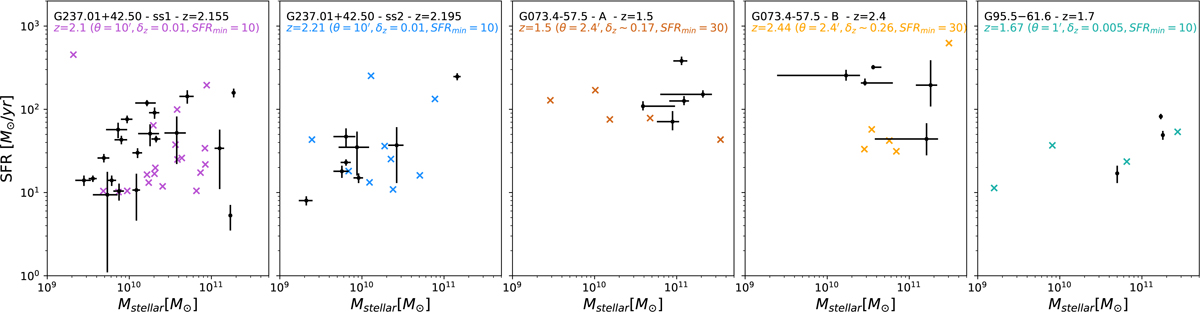
Fig. 7.
Download original image
Star formation rates as a function of stellar masses of the galaxy members in the five confirmed structures (coloured crosses) and of those drawn from the closest simulated case (black points). The simulated data were obtained from all the galaxies inside a cylinder around a specific SF halo with total SFR and stellar mass that are the closest to those measured in the observations (see red crosses in Fig. 6). Each panel shows a different structure whose name and redshift are noted in black on the top.
Current usage metrics show cumulative count of Article Views (full-text article views including HTML views, PDF and ePub downloads, according to the available data) and Abstracts Views on Vision4Press platform.
Data correspond to usage on the plateform after 2015. The current usage metrics is available 48-96 hours after online publication and is updated daily on week days.
Initial download of the metrics may take a while.