Fig. 9
Download original image
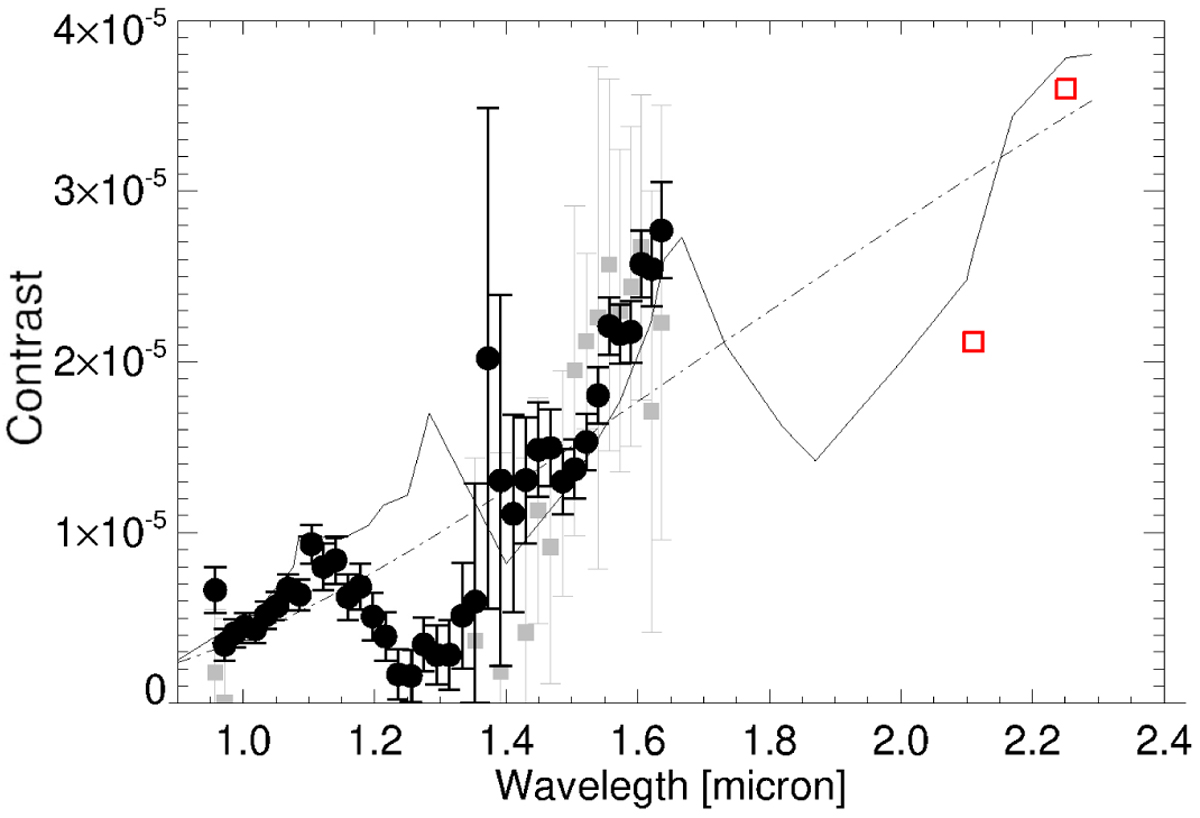
Contrast spectrum for CC0 obtained with PACO-ASDI from 2018 IFS data (black dots) and from PACO-ASDI for IRDIS data acquired at the same epoch (5→ upper limits; red squares). The second-epoch ASDI-PCA spectrum (gray squares) is shown for reference. The solid line is the contrast spectrum expected for a 20 Myr old, 19.5 MJ brown dwarf using AMES-Dusty models. The dot-dashed line is a black body curve with the same temperature and radius as this model.
Current usage metrics show cumulative count of Article Views (full-text article views including HTML views, PDF and ePub downloads, according to the available data) and Abstracts Views on Vision4Press platform.
Data correspond to usage on the plateform after 2015. The current usage metrics is available 48-96 hours after online publication and is updated daily on week days.
Initial download of the metrics may take a while.