Fig. 6
Download original image
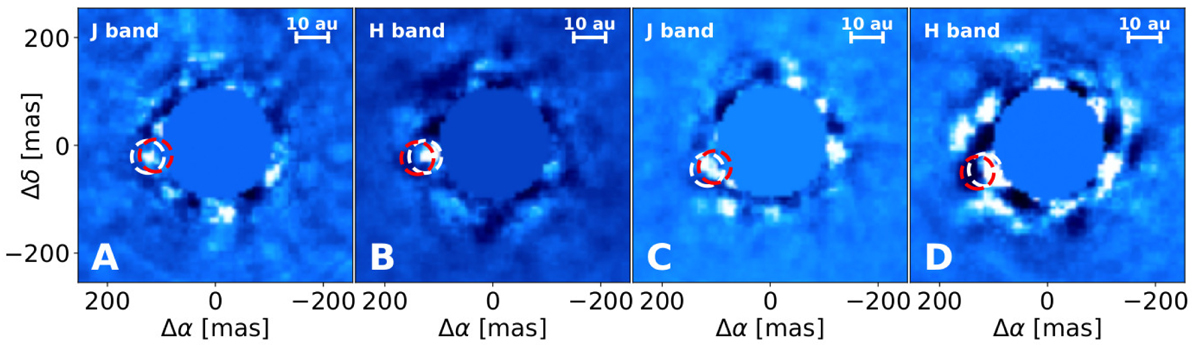
Position of CC0 at different wavelengths. (A) J-band image, first epoch; (B) H-band image, first epoch; (C) J-band image, second epoch; (B) H-band image, second epoch. The Y-band image is not shown due to the extreme faintness of the source. White circles indicate the best-fit positions from Table E.1; circle radii have been enlarged to ~10 times the uncertainties on best-fit positions to enhance visibility. Unlike a speckle (red circle), the separation of CC0 does not increase with wavelength.
Current usage metrics show cumulative count of Article Views (full-text article views including HTML views, PDF and ePub downloads, according to the available data) and Abstracts Views on Vision4Press platform.
Data correspond to usage on the plateform after 2015. The current usage metrics is available 48-96 hours after online publication and is updated daily on week days.
Initial download of the metrics may take a while.