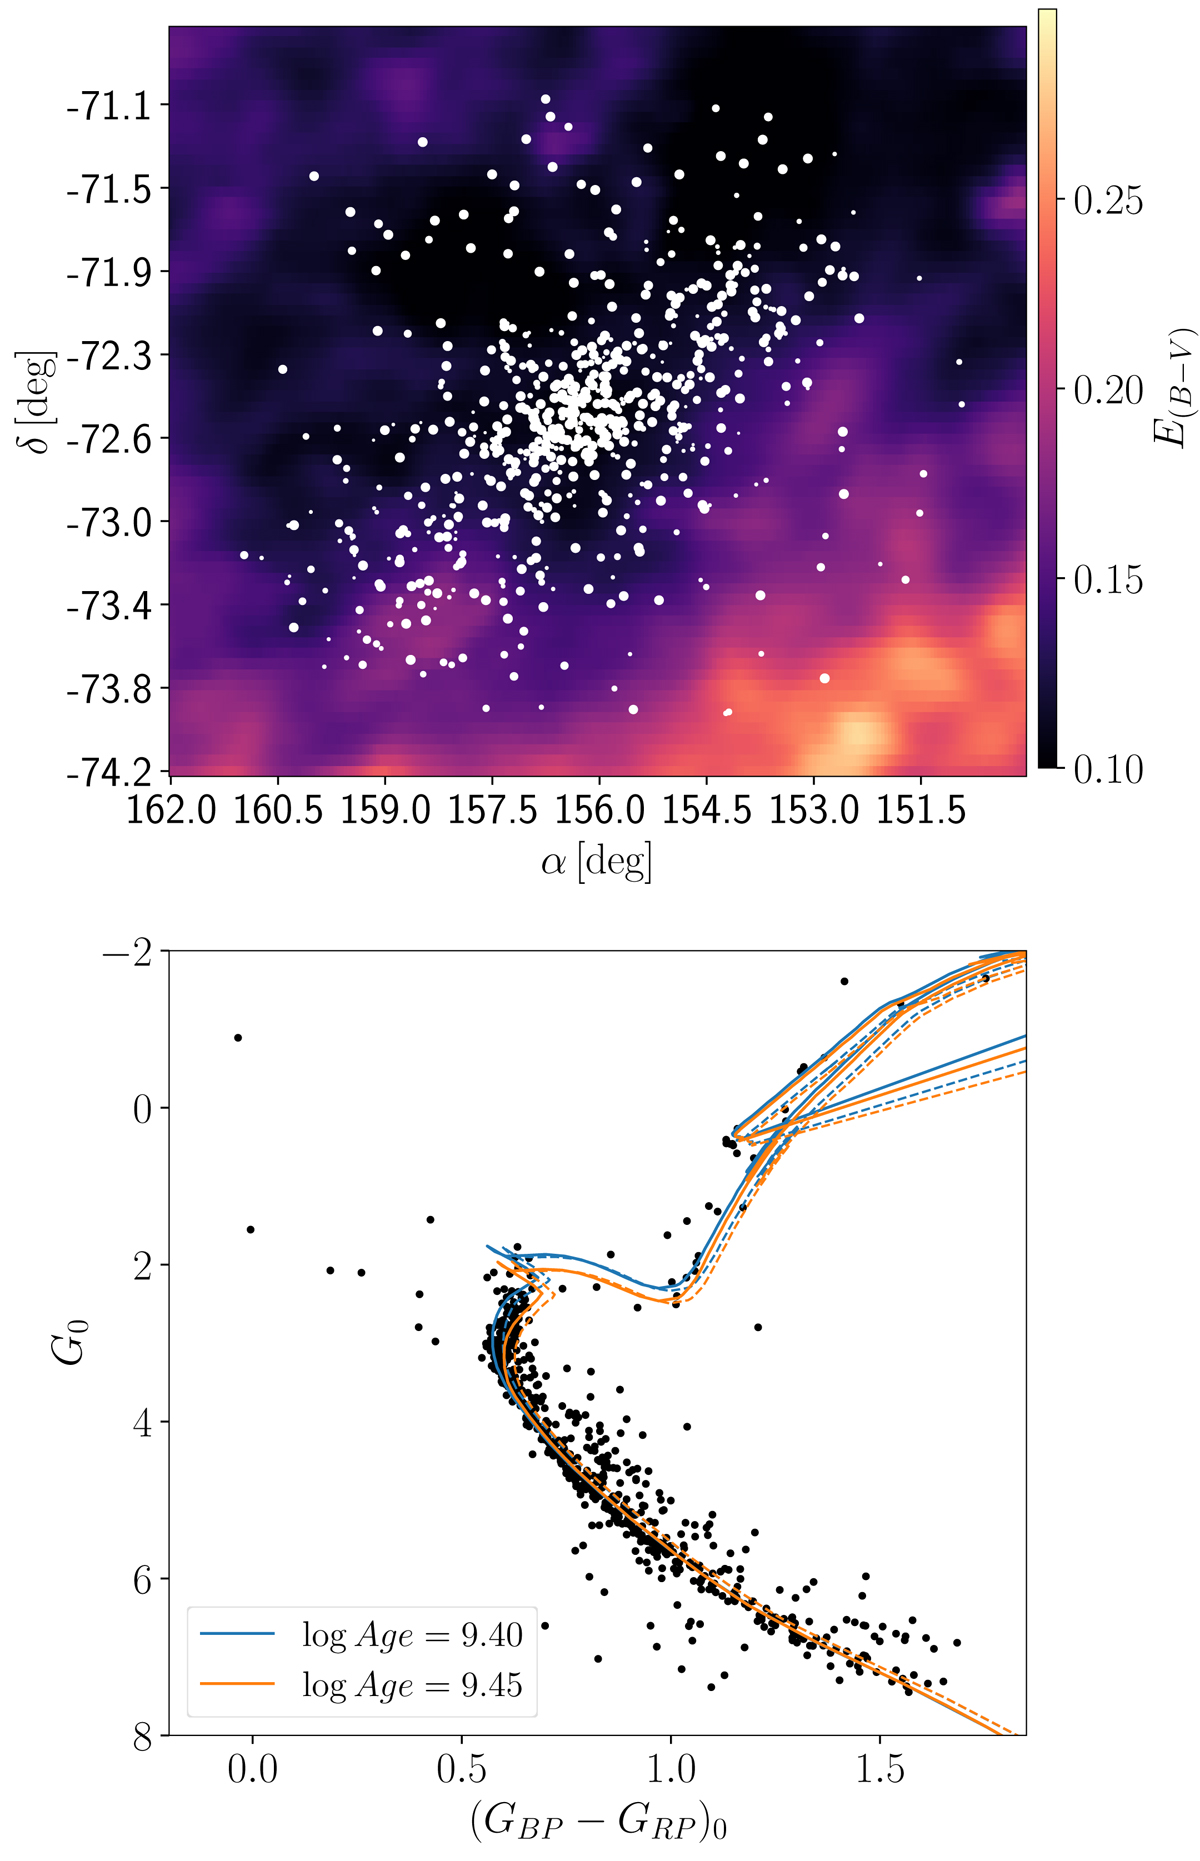
Fig. 8.
Download original image
Top: 2D reddening map of the cluster field with members overplotted (size is scaled with the probability of membership). Bottom: intrinsic CMD in the Gaia EDR3 passbands. Isochrones of two different ages (in blue and orange) and [M/H] = −0.1 are plotted with solid lines. The dashed lines correspond to the isochrones of [M/H] = 0.0.
Current usage metrics show cumulative count of Article Views (full-text article views including HTML views, PDF and ePub downloads, according to the available data) and Abstracts Views on Vision4Press platform.
Data correspond to usage on the plateform after 2015. The current usage metrics is available 48-96 hours after online publication and is updated daily on week days.
Initial download of the metrics may take a while.