Fig. 7.
Download original image
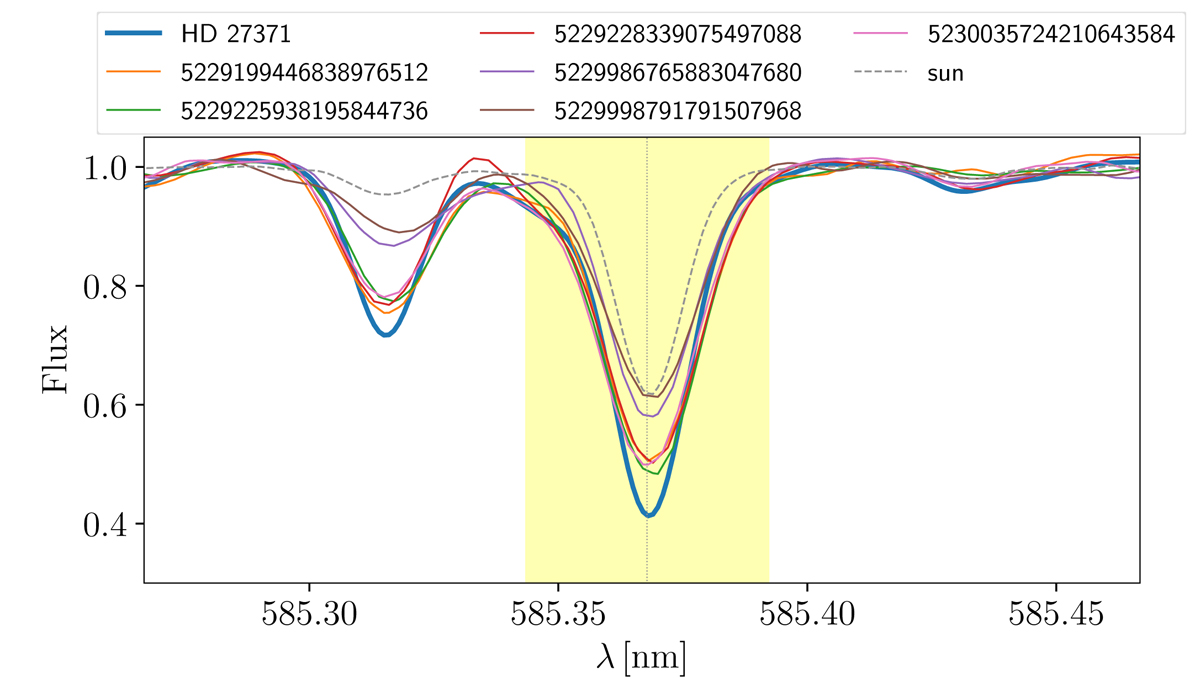
Observed spectra for the Ba II line at 585.3668 nm. The thick blue line shows the giant star from the Hyades cluster used as a reference for the differential analysis, and the dashed grey line shows the solar spectrum analysed from MIKE. The red clump giants from UBC 274 correspond to the orange, green, red, and pink lines, and the sub-giants are in brown and violet.
Current usage metrics show cumulative count of Article Views (full-text article views including HTML views, PDF and ePub downloads, according to the available data) and Abstracts Views on Vision4Press platform.
Data correspond to usage on the plateform after 2015. The current usage metrics is available 48-96 hours after online publication and is updated daily on week days.
Initial download of the metrics may take a while.