Fig. A.1.
Download original image
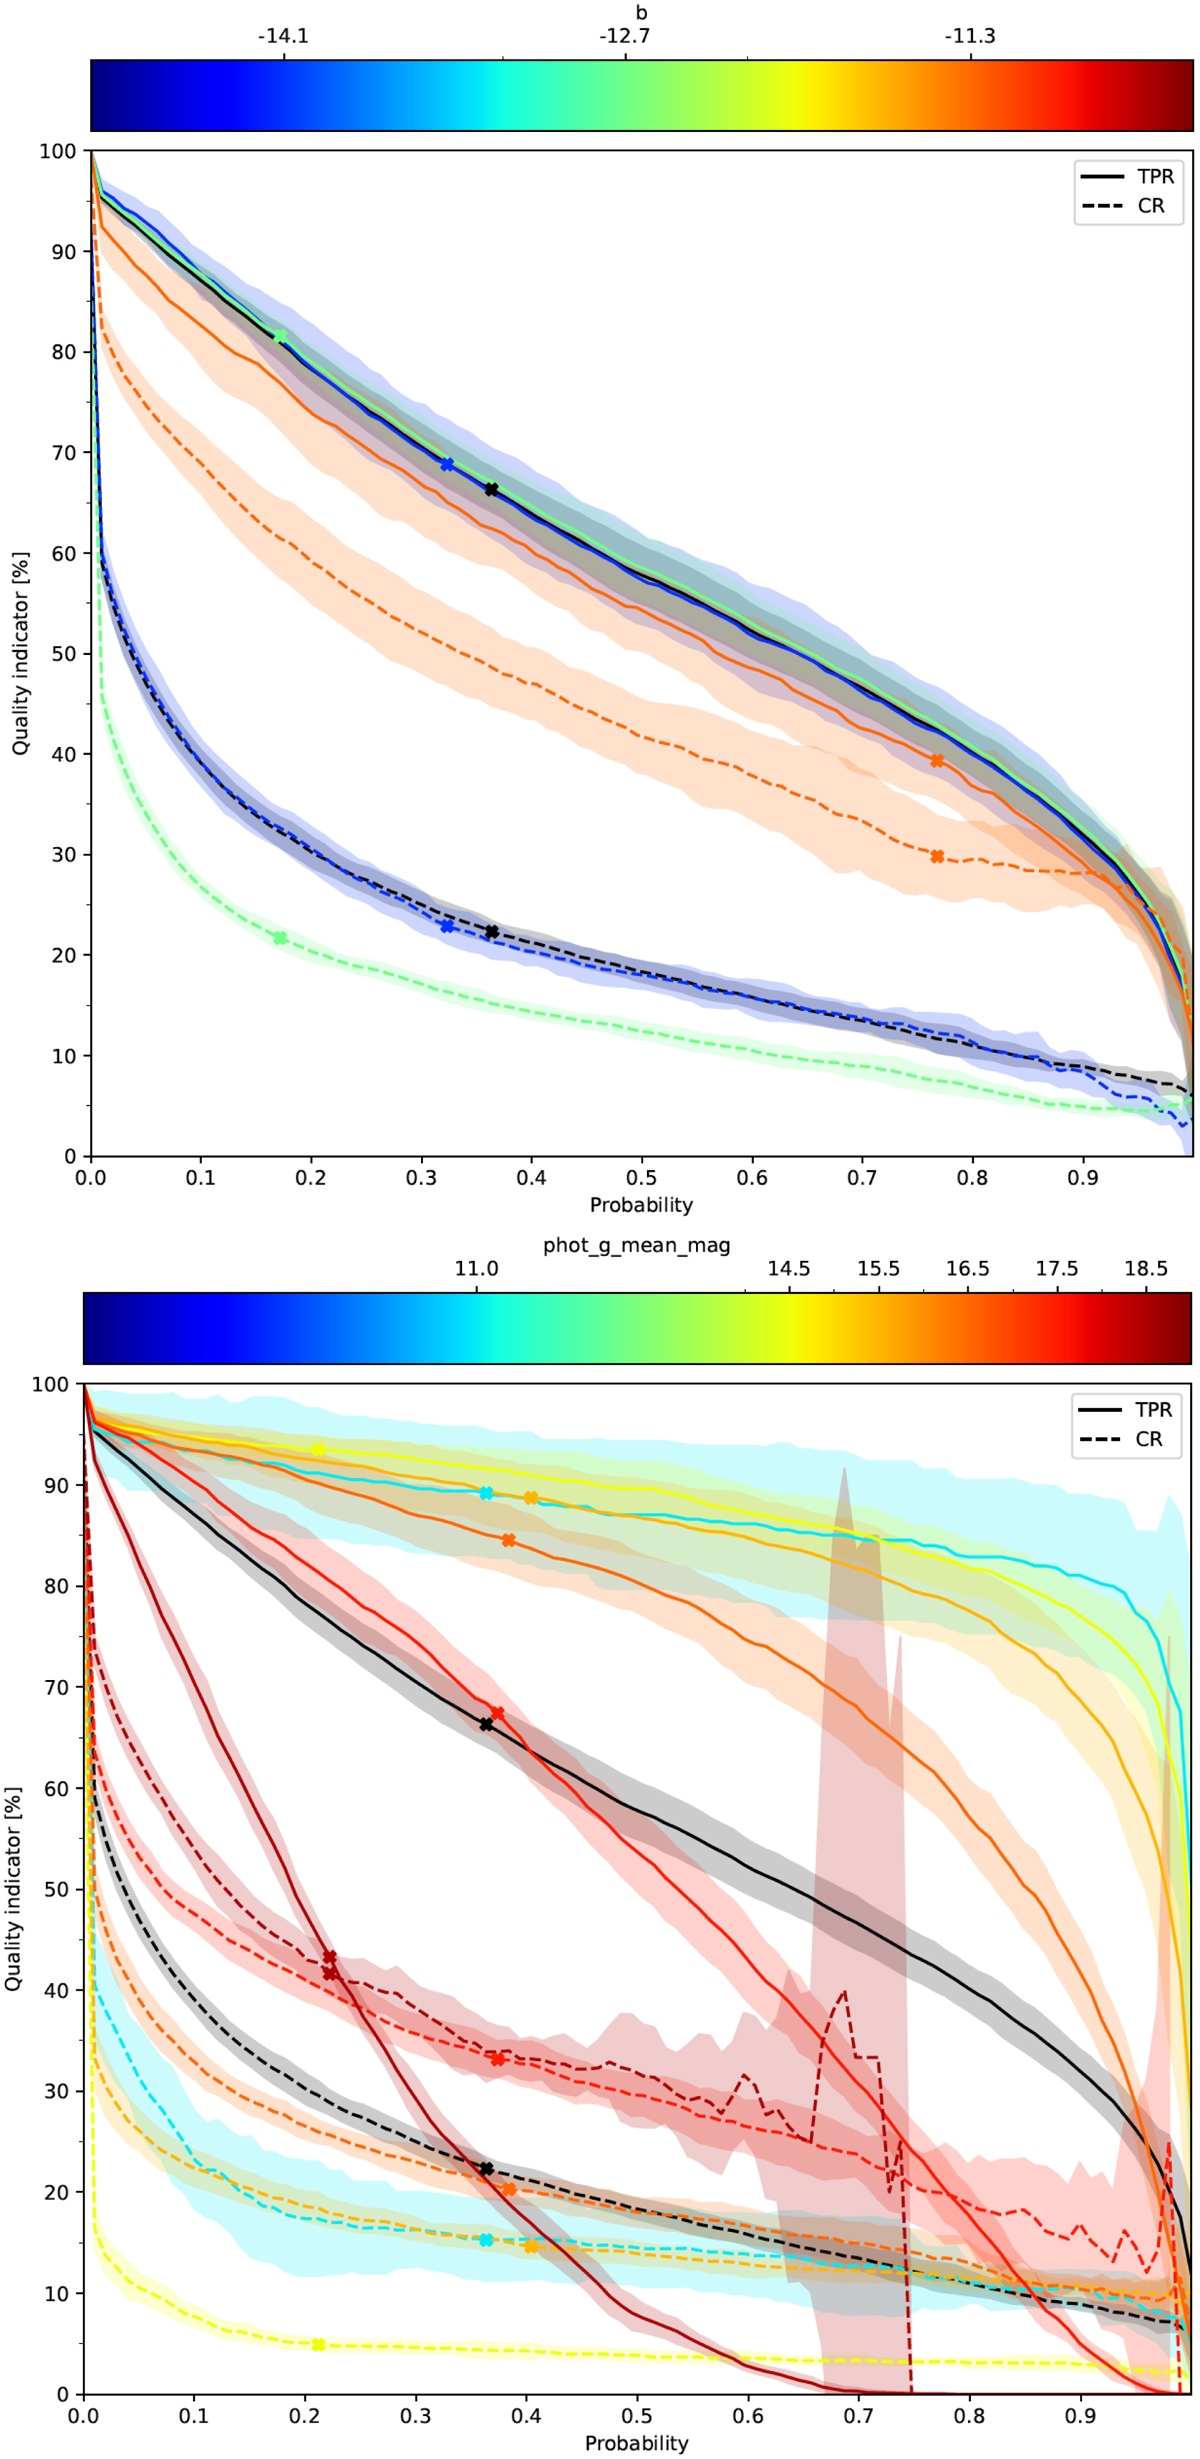
TPR (solid lines) and CR (dashed lines) as a function of the probability computed by our membership method (Sect. 2), in bins of Galactic latitude b (top) and G magnitude (bottom). The crosses indicate the optimum probability thresholds that maximise the accuracy of the classifier (i.e. the fraction of correct classifications) at each bin, and are those detailed in Table A.1. The black line indicates the global performance and the shaded regions depict the standard deviation of the ten synthetic simulations.
Current usage metrics show cumulative count of Article Views (full-text article views including HTML views, PDF and ePub downloads, according to the available data) and Abstracts Views on Vision4Press platform.
Data correspond to usage on the plateform after 2015. The current usage metrics is available 48-96 hours after online publication and is updated daily on week days.
Initial download of the metrics may take a while.