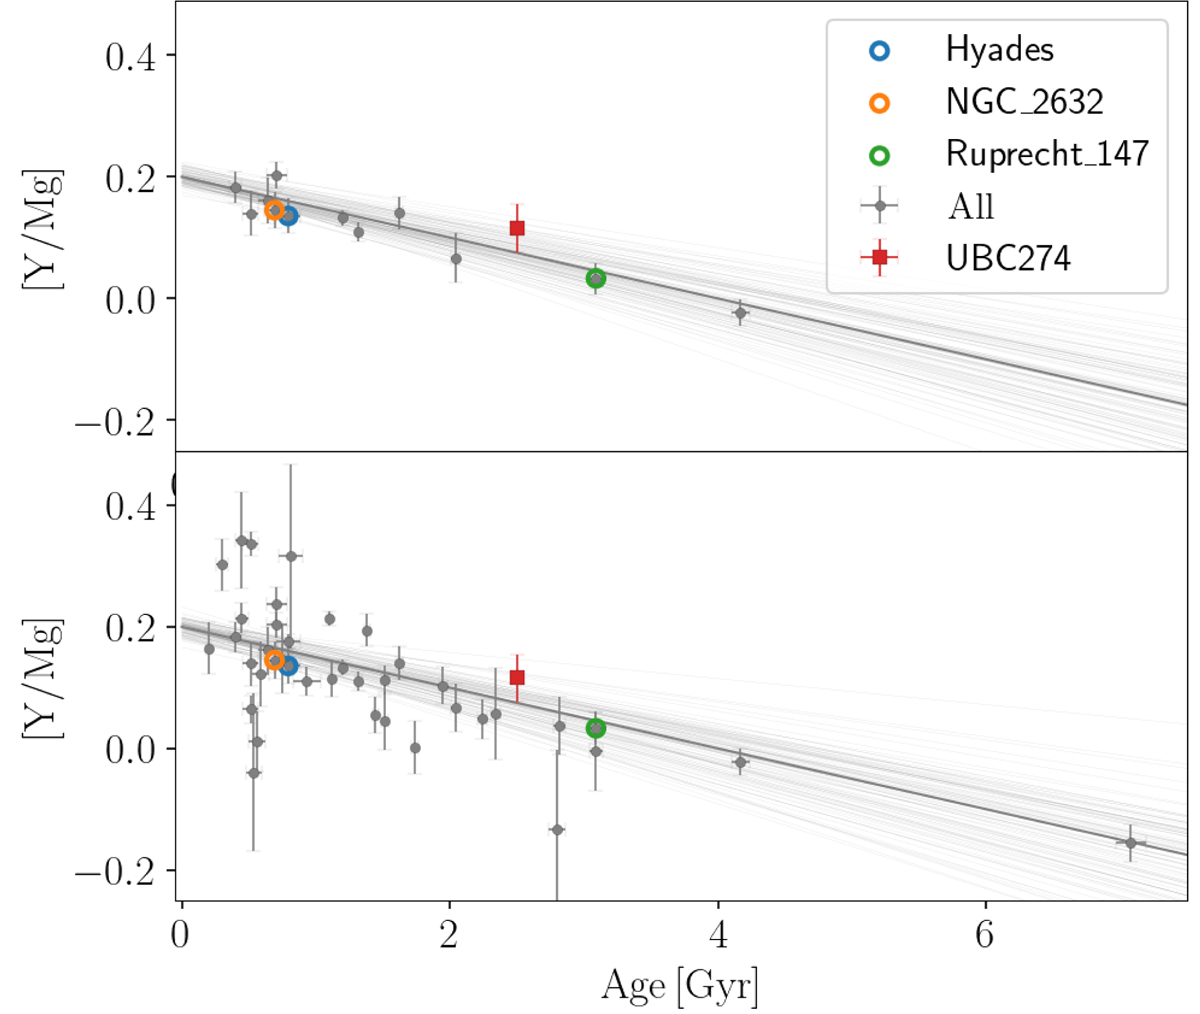
Fig. 10.
Download original image
[Y/Mg] abundances of the sample of clusters from Casamiquela et al. (2021) in grey, and the linear fit computed. The values of the Hyades, NGC 2632 and Ruprecht 147 clusters are highlighted. The value computed in this paper for UBC 274 is plotted as a red square. Top plot: shows the clusters closer than d < 1 kpc, and the bottom plot shows all the clusters in the sample.
Current usage metrics show cumulative count of Article Views (full-text article views including HTML views, PDF and ePub downloads, according to the available data) and Abstracts Views on Vision4Press platform.
Data correspond to usage on the plateform after 2015. The current usage metrics is available 48-96 hours after online publication and is updated daily on week days.
Initial download of the metrics may take a while.